| Fire incidents reported |
|---|
| Sreet name | Count |
|---|
| NORTH | 12 | | DENVER | 10 | | HANOVER | 10 | | HWY 36 | 10 | | K148 | 10 | | ALL AMERCIAN ROAD | 8 | | FOOTBALL FIELD | 8 | | HARBINE ST. | 8 | | 23RD ROAD | 6 | | BIG BEAR ROAD | 6 | | CHARLESTON TOWNSHIP | 6 | | CROSS CREEK ROAD | 6 | | HOLLENBERG | 6 | | RAILROAD | 6 | | WASHINGTON ST | 6 | | 19TH RD | 4 | | 21ST ROAD | 4 | | 2313 18TH ROAD | 4 | | 26TH ROAD | 4 | | COUNTY LINE RD | 4 | | EAST | 4 | | ELM | 4 | | FRANKLIN TOWNSHIP | 4 | | FRANKLIN TOWNSHIP SEC 27 | 4 | | HIGHLAND SECTION 2 | 4 |
| | | Fire incidents reported |
|---|
| Sreet name | Count |
|---|
| JAEDICKE | 4 | | MAIN STREET | 4 | | QUIVERA ROAD | 4 | | S EAST | 4 | | SPENCE AVE | 4 | | UPLAND RD | 4 | | UPLAND ROAD | 4 | | VETERANS DRIVE | 4 | | VICTORY RD | 4 | | W NORTH | 4 | | WAGON TRAIN RD | 4 | | WAGONTRAIN ROAD | 4 | | YUKON BLVD | 4 | | 15TH RD | 2 | | 17TH RD | 2 | | 18TH RD | 2 | | 18TH ROAD | 2 | | 19TH RD | 2 | | 205 S RAILROAD | 2 | | 20TH ROAD | 2 | | 2194 ALL AMERICAN RD. | 2 | | 2194 ALL AMERICAN ROAD | 2 | | 21ST RD | 2 | | 2200 YUKON BLVD. | 2 | | |
|
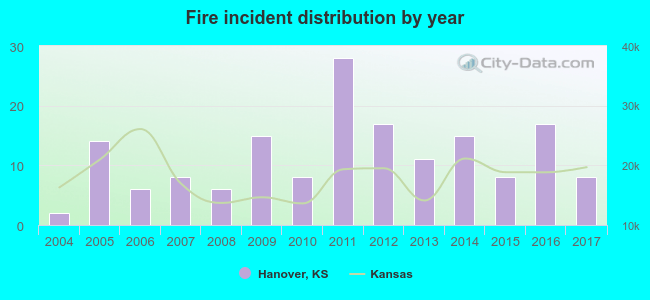 Based on the data from the years 2004 - 2017 the average number of fires per year is 12. The highest number of fires - 28 took place in 2011, and the least - 2 in 2004. The data has a growing trend.
 29.4% incidents where reported in the morning and 70.6% in the evening. The most fires (22.1%) took place on Sunday, and the least (8.0%) on Wednesday.
 According to the 163 reports from years 2004 - 2017 most fires (19.0%) took place during April, and the least (3.7%) in January.
 Out of all 279 cases reported during the years 2004 - 2017, the most belonged to the categories: Fire (58.4%), Rescue & EMS (30.5%), and Overpressure Rupture (5.4%).
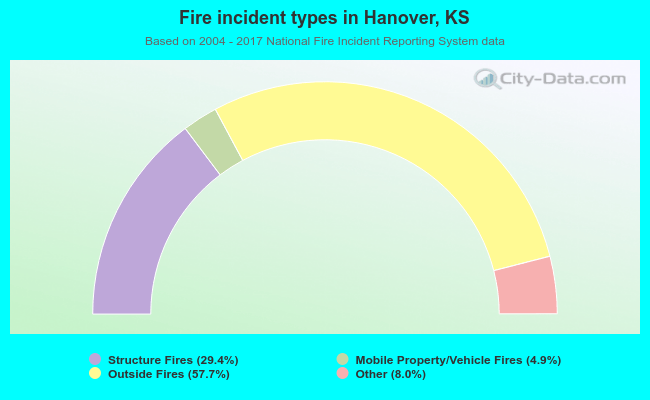 When looking into fire subcategories, the most incidents belonged to: Outside Fires (57.7%), and Structure Fires (29.4%).