| Fire incidents reported |
|---|
| Sreet name | Count |
|---|
| ANTWERP RD | 16 | | STATE ROAD 37 SPR HWY | 16 | | CUBA RD | 12 | | SR 37 | 12 | | STATE ROAD 101 RD | 10 | | STATE ROAD 37 HWY | 10 | | THIMLAR RD | 8 | | WATER ST | 8 | | ANTWERP-SPR RD | 6 | | ANTWERPSPR RD | 6 | | BULL RAPIDS RD | 6 | | CAMPBELL RD | 6 | | NOTESTINE - SPR RD | 6 | | ROBERTS RD | 6 | | SCHOOL ST | 6 | | SR 101 | 6 | | STATE ROAD 37- SPR HWY | 6 | | TRAMMEL RD | 6 | | 1631 CAMPBELL RD | 4 | | ALLEN RD | 4 | | APPLEGATE DR | 4 | | DARLING RD | 4 | | HOOD ST | 4 | | HURSHTOWN RD | 4 | | NOTESTINE RD | 4 |
| | | Fire incidents reported |
|---|
| Sreet name | Count |
|---|
| NOTESTINE RD | 4 | | NOTESTINE SPR RD | 4 | | NOTESTINE-MIL RD | 4 | | SCIPIO RD | 4 | | SPENCERVILLE RD | 4 | | SR 37 RD | 4 | | ST RD 37 | 4 | | ST. RD. 101 | 4 | | STATE LINE RD | 4 | | STATE ROAD 101 | 4 | | 101 NORTH OF 37 | 2 | | 11219 ST RD 37 | 2 | | 11712 ROBERTS RD | 2 | | 11729 STOPHER RD | 2 | | 12033 WATERS ST | 2 | | 12110 SCHOOL ST | 2 | | 14322 SCIPIO ROAD | 2 | | 14900 BLOCK ALLEN RD. | 2 | | 14935 SCIPIO RD | 2 | | 15000 ALLEN RD | 2 | | 15525 ST RD 101 | 2 | | 16301 TRAMMEL RD | 2 | | 16415 SUNSET PASS | 2 | | 17000 RUPERT RD | 2 | | |
|
 According to the data from the years 2002 - 2018 the average number of fires per year is 12. The highest number of reported fires - 23 took place in 2012, and the least - 0 in 2014. The data has a declining trend.
 24.2% incidents where reported in the morning and 75.8% in the evening. The most fires (20.7%) took place on Tuesday, and the least (10.6%) on Sunday.
 Based on the 198 reports from years 2002 - 2018 most fires (13.6%) took place during April, and the least (4.5%) in September.
 Out of all 579 cases reported during the years 2002 - 2018, the most belonged to the categories: Overpressure Rupture (40.8%), Fire (34.2%), and Rescue & EMS (16.1%).
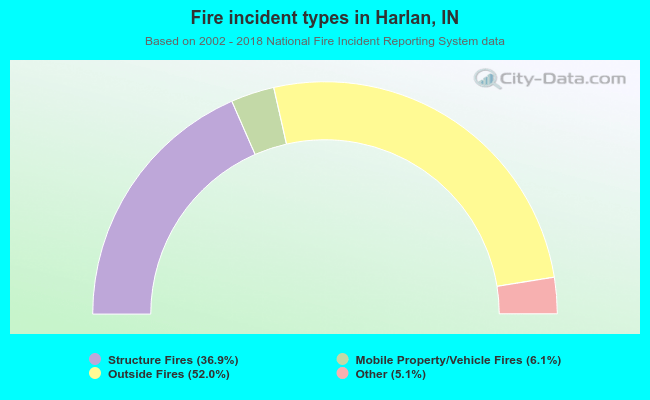 When looking into fire subcategories, the most reports belonged to: Outside Fires (52.0%), and Structure Fires (36.9%).