| Fire incidents reported |
|---|
| Sreet name | Count |
|---|
| RIVER RD | 32 | | BELVIDERE RD | 26 | | HARMONY BRASS CASTLE RD | 24 | | RIDGE RD | 18 | | REEDER RD | 16 | | HARMONY STATION RD | 12 | | MARBLE HILL RD | 8 | | ALPHA ST | 6 | | BRASS CASTLE RD | 6 | | FOX FARM RD | 6 | | MONTANA RD | 6 | | 519 RT | 4 | | BRAINARDS RD | 4 | | BRAINYARDS RD | 4 | | FIDDLERS ELBOW RD | 4 | | FOUL RIFT RD | 4 | | THIRD AVE | 4 | | WESTOR | 4 | | ALLAN MILL RD | 2 | | AUBLE RD | 2 | | BIRCH LN | 2 | | BRIARSTONE AVE | 2 | | BUCKHORN DR | 2 | | BUTTONWOOD LN | 2 | | CARPENTERVILLE RD | 2 |
| | | Fire incidents reported |
|---|
| Sreet name | Count |
|---|
| DAVIDSON LN | 2 | | ESPOSITO RD | 2 | | FIDDLERS ELBOW | 2 | | FIELDSTONE CT | 2 | | FOXFARM ROAD | 2 | | GREENWICH ST | 2 | | GRIST MILL RD | 2 | | HARMONY BRASS CASTLE RD | 2 | | HARMONY TERRACE | 2 | | HARMONYBRASS CASTLE RD | 2 | | HUTCHINSON RIVER RD | 2 | | HUTCHINSON STATION RD | 2 | | HUTCHINSON STATION RD | 2 | | HUTCHINSON STATION ROAD | 2 | | HUTCHINSON STATION ST | 2 | | MANSFIELD ST | 2 | | QUENBY MOUNTAIN RD | 2 | | RAILROAD AVE | 2 | | RICHLINE RD | 2 | | RIDGE RD. | 2 | | SLATER LN | 2 | | SLOAN LN | 2 | | SOUTH SECOND ST | 2 | | SPRING LN | 2 | | |
|
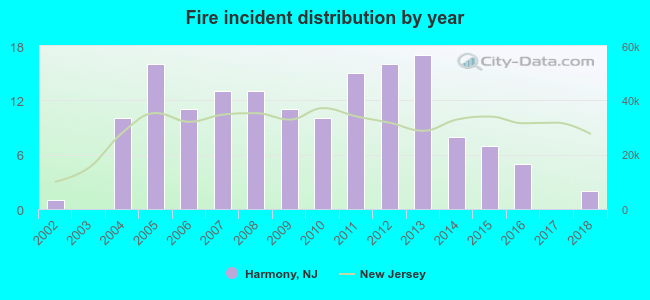 Based on the data from the years 2002 - 2018 the average number of fire incidents per year is 9. The highest number of reported fire incidents - 17 took place in 2013, and the least - 0 in 2003. The data has a growing trend.
 31.0% incidents where reported in the morning and 69.0% in the evening. The most fires (23.2%) took place on Saturday, and the least (8.4%) on Wednesday.
 According to the 155 fire incident reports from years 2002 - 2018 most fires (17.4%) took place during April, and the least (4.5%) in September.
 Out of all 328 cases reported during the years 2002 - 2018, the most belonged to the categories: Fire (47.3%), Rescue & EMS (28.0%), and Overpressure Rupture (18.6%).
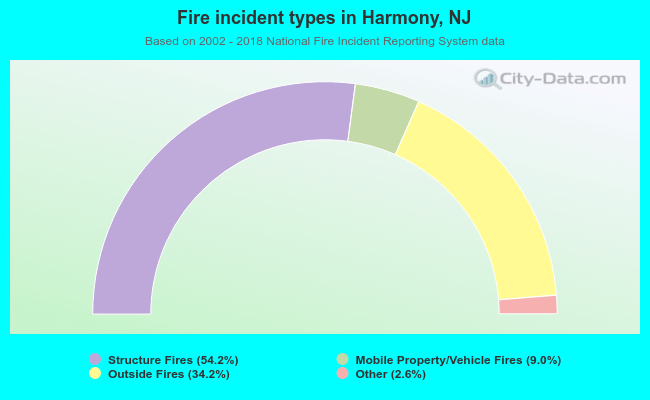 When looking into fire subcategories, the most incidents belonged to: Structure Fires (54.2%), and Outside Fires (34.2%).