Harrah: Fire Incidents, Washington (WA)
Where are fire incidents reported in Harrah, WA
Something went wrong! Please refresh the page.
|
| |||||||||||||||||||||||||||||||||||||||||||||||||||||||||||||||||||||||||||||||||||||||||||||||||||||||||||||
2002 - 2018 National Fire Incident Reporting System (NFIRS) incidents
- Incident types reported to NFIRS in Harrah, WA
- 37548.0%Rescue & EMS
- 29437.6%Fire
- 759.6%Good Intent Call
- 131.7%Hazardous Condition
- 121.5%Service Call
- 121.5%False Alarm
- Fire incident types reported to NFIRS in Harrah, WA
- 18261.9%Outside Fires
- 5318.0%Structure Fires
- 4615.6%Mobile Property/Vehicle Fires
- 134.4%Other
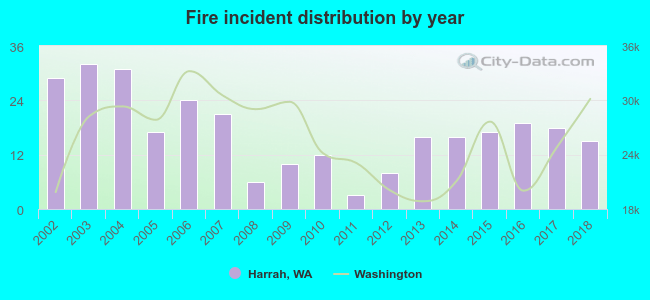 Based on the data from the years 2002 - 2018 the average number of fires per year is 17. The highest number of reported fire incidents - 32 took place in 2003, and the least - 3 in 2011. The data has a decreasing trend.
 According to the reports from the years 2002 - 2018 the average number of fire-related yearly casualties is 0. The highest number of reported injuries - 3 took place in 2007, and the lowest - 0 in 2002. The data has a constant trend.
 28.2% incidents where reported in the morning and 71.8% in the evening. The most fires (19.4%) took place on Tuesday, and the least (11.6%) on Friday.
 Based on the 294 fire incident reports from years 2002 - 2018 most fires (19.7%) took place during July, and the least (3.7%) in January.
 Out of all 781 cases reported during the years 2002 - 2018, the most belonged to the categories: Overpressure Rupture (48.0%), Fire (37.6%), and Service Call (9.6%).
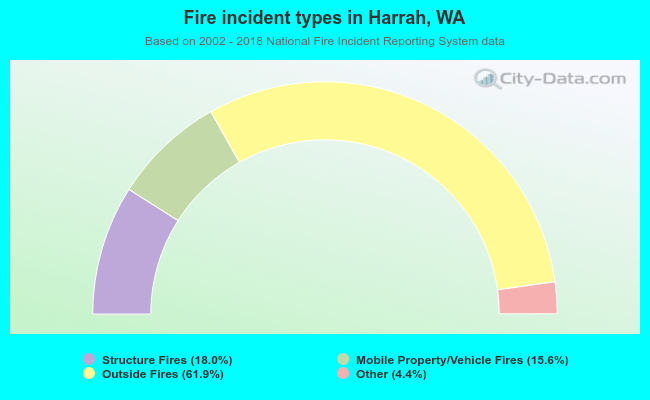 When looking into fire subcategories, the most reports belonged to: Outside Fires (61.9%), and Structure Fires (18.0%).