| Fire incidents reported |
|---|
| Sreet name | Count |
|---|
| BLANCHE AVENUE | 14 | | HIGHLAND AVENUE | 12 | | BOGERTS MILL ROAD | 10 | | HARRIOT AVENUE | 10 | | PARKWAY | 10 | | STONEBROOK COURT | 10 | | DOROTOCKEY DRIVE | 8 | | HACKENSACK AVENUE | 8 | | LAFAYETTE ROAD | 8 | | MARTHA ROAD | 8 | | DOWNING PLACE | 6 | | LAROCHE AVENUE | 6 | | OLD HOOK RD | 6 | | OLD HOOK ROAD | 6 | | PINE PLACE | 6 | | SCHRAALENBURGH ROAD | 6 | | TAPPAN ROAD | 6 | | AMELIA COURT | 4 | | BROOK STREET | 4 | | BYRNE LANE | 4 | | COOPER PLACE | 4 | | DEAL STREET | 4 | | GREENWAY | 4 | | HERRING STREET | 4 | | HIGGINS PLACE | 4 |
| | | Fire incidents reported |
|---|
| Sreet name | Count |
|---|
| LEE AVENUE | 4 | | LYNN STREET | 4 | | PASCACK ROAD | 4 | | PEAT STREET | 4 | | PONDSIDE COURT | 4 | | SOUTH AVENUE | 4 | | 60 BLANCH AVE | 2 | | 71 HIGHLAND AVE. | 2 | | BEECHWOOD PLACE | 2 | | BLANCH AVE | 2 | | BLAUVELT DRIVE | 2 | | CEDAR LANE | 2 | | COLONIAL | 2 | | COLONIAL DRIVE NORTH | 2 | | DEAN STREET | 2 | | DIMAS COURT | 2 | | EASTBROOK ROAD | 2 | | ECKERSON ROAD | 2 | | EHRET AVENUE | 2 | | FIRST STREET | 2 | | FLINT TERRACE | 2 | | FRIEND TERRACE | 2 | | GUY STREET | 2 | | HARRIET AVE | 2 | | |
|
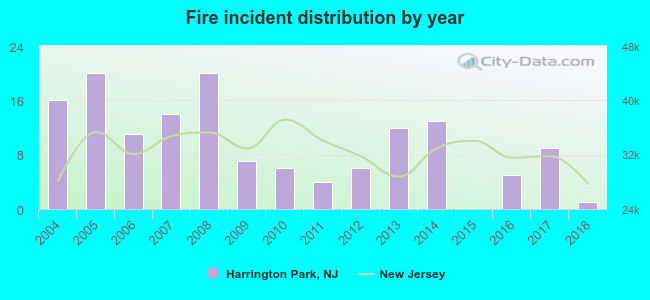 Based on the data from the years 2004 - 2018 the average number of fire incidents per year is 10. The highest number of reported fire incidents - 20 took place in 2005, and the least - 0 in 2015. The data has a dropping trend.
 24.3% incidents where reported in the morning and 75.7% in the evening. The most fires (20.1%) took place on Friday, and the least (9.7%) on Thursday.
 According to the 144 fire incident reports from years 2004 - 2018 most fires (14.6%) took place during January, and the least (2.8%) in August.
 Out of all 575 cases reported during the years 2004 - 2018, the most belonged to the categories: Hazardous Condition (39.5%), Fire (25.0%), and False Alarm (20.9%).
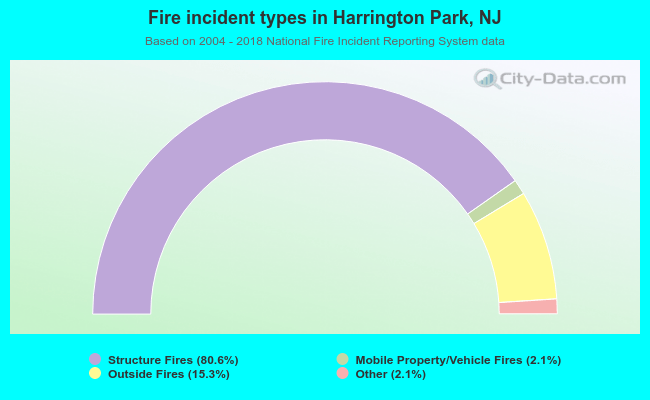 When looking into fire subcategories, the most incidents belonged to: Structure Fires (80.6%), and Outside Fires (15.3%).