Harrison: Fire Incidents, Arkansas (AR)
Where are fire incidents reported in Harrison, AR
Something went wrong! Please refresh the page.
| Fire incidents reported | |
|---|---|
| Sreet name | Count |
| HWY 7 | 146 |
| TAR KILN RD | 76 |
| ZINC RD | 76 |
| WOODED HILLS RD | 54 |
| COTTONWOOD RD | 52 |
| MOARK DR | 48 |
| HWY 43 | 46 |
| HARMON RD | 44 |
| MAIN ST | 36 |
| HWY 65 | 32 |
| MAIN | 32 |
| MORGAN CAVE RD | 26 |
| SUGAR RD | 26 |
| HWY 392 | 24 |
| INDUSTRIAL PARK RD | 24 |
| MAPLE | 24 |
| YORK DR | 24 |
| HARMON ROAD | 22 |
| HOPEWELL RD | 22 |
| HWY 281 | 22 |
| INDUSTRIAL PARK RD | 22 |
| NORVEL DR | 22 |
| SUNRISE LN | 22 |
| HWY 7 NORTH | 20 |
| SANSING HOLLOW RD | 20 |
| BLEVINS RD | 18 |
| DUBUQUE RD | 18 |
| HWY 7 SOUTH | 18 |
| NORVELL DR | 18 |
| PINE | 18 |
| Other | 1,701 |
2002 - 2018 National Fire Incident Reporting System (NFIRS) incidents
- Incident types reported to NFIRS in Harrison, AR
- 3,45440.9%Rescue & EMS
- 2,75332.6%Fire
- 6267.4%Good Intent Call
- 6237.4%Hazardous Condition
- 5606.6%Service Call
- 3914.6%False Alarm
- 190.2%Special Incident
- 140.2%Overpressure Rupture
- 120.1%Severe Weather
- Fire incident types reported to NFIRS in Harrison, AR
- 1,46853.3%Outside Fires
- 81429.6%Structure Fires
- 39614.4%Mobile Property/Vehicle Fires
- 752.7%Other
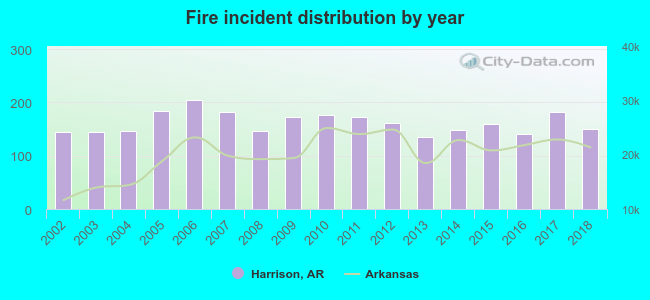 According to the data from the years 2002 - 2018 the average number of fires per year is 162. The highest number of fires - 204 took place in 2006, and the least - 135 in 2013. The data has an increasing trend.
The average number of yearly fire incidents per 10k residents in Harrison, AR compared to nearest cities:
(Note: Based on data for the last 3 years, including only cities with population 5,000 and above)
| Harrison: | 119.8 |
| Berryville: | 127.1 |
| Mountain Home: | 121.1 |
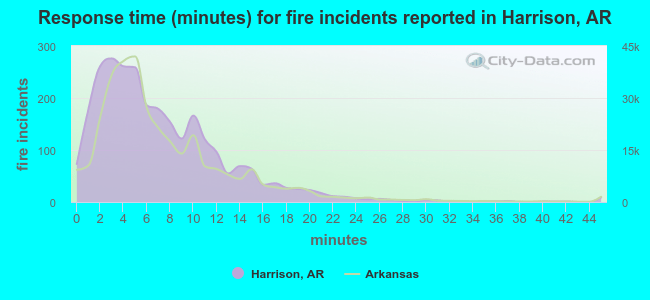 The median response time based on all reported fire incidents is 6 minutes. This is similar to the Arkansas median value.
The median response time in Harrison, AR compared to nearest cities:
(Note: Based on data for all years, including only cities with at least 500 fire incidents)
| Harrison: | 6 minutes |
| Green Forest: | 11 minutes |
| Yellville: | 12 minutes |
| Berryville: | 9 minutes |
| Flippin: | 10 minutes |
| Gassville: | 8 minutes |
| Huntsville: | 11 minutes |
| Eureka Springs: | 8 minutes |
| Mountain Home: | 8 minutes |
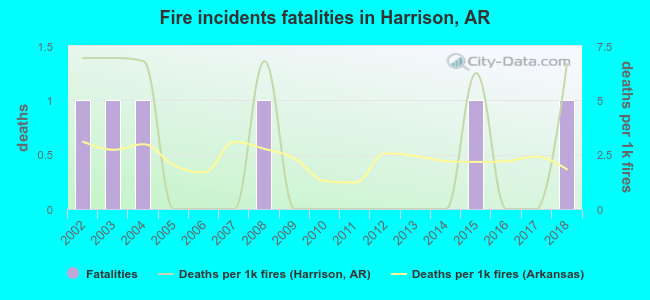 Based on the reports from the years 2002 - 2018 the average number of fire-related fatalities per year is 0. The highest number of reported deaths - 1 took place in 2002, and the lowest - 0 in 2005. The data has a constant trend.
The average number of deaths per 1,000 fires is 2. This indicator was the highest - 7 in 2002, and the lowest 0 in 2005. The trend for deaths per 1,000 fires is decreasing. Compared to the Arkansas value the number of fatalities per 1,000 fire incidents is about the same.
Based on the reports from the years 2002 - 2018 the average number of fire-related fatalities per year is 0. The highest number of reported deaths - 1 took place in 2002, and the lowest - 0 in 2005. The data has a constant trend.
The average number of deaths per 1,000 fires is 2. This indicator was the highest - 7 in 2002, and the lowest 0 in 2005. The trend for deaths per 1,000 fires is decreasing. Compared to the Arkansas value the number of fatalities per 1,000 fire incidents is about the same.Deaths per 1,000 incidents in Harrison, AR compared to nearest cities:
(Note: Based on data for all years, including only cities with at least 2,500 fire incidents)
| Harrison: | 2.2 |
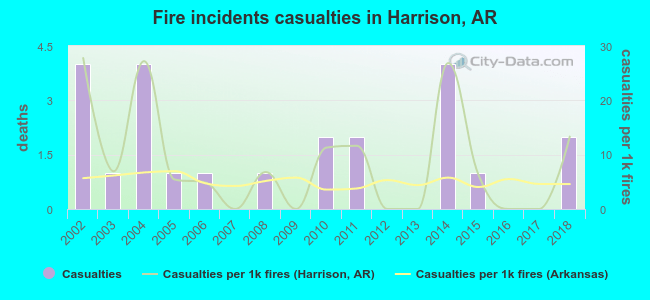 According to the data from the years 2002 - 2018 the average number of fire-related yearly casualties is 1. The highest number of reported injuries - 4 took place in 2002, and the lowest - 0 in 2007. The data has a decreasing trend.
The average number of casualties per 1,000 fires is 9. This indicator was the highest - 28 in 2002, and the lowest 0 in 2007. The trend for injuries per 1,000 incidents is dropping. Compared to the state value the number of injuries per 1,000 fire incidents is higher.
According to the data from the years 2002 - 2018 the average number of fire-related yearly casualties is 1. The highest number of reported injuries - 4 took place in 2002, and the lowest - 0 in 2007. The data has a decreasing trend.
The average number of casualties per 1,000 fires is 9. This indicator was the highest - 28 in 2002, and the lowest 0 in 2007. The trend for injuries per 1,000 incidents is dropping. Compared to the state value the number of injuries per 1,000 fire incidents is higher.Casualties per 1,000 incidents in Harrison, AR compared to nearest cities:
(Note: Based on data for all years, including only cities with at least 500 fire incidents)
| Harrison: | 8.4 |
| Green Forest: | 2.0 |
| Yellville: | 1.3 |
| Berryville: | 2.8 |
| Flippin: | 1.0 |
| Gassville: | 0.0 |
| Huntsville: | 6.8 |
| Eureka Springs: | 0.0 |
| Mountain Home: | 4.9 |
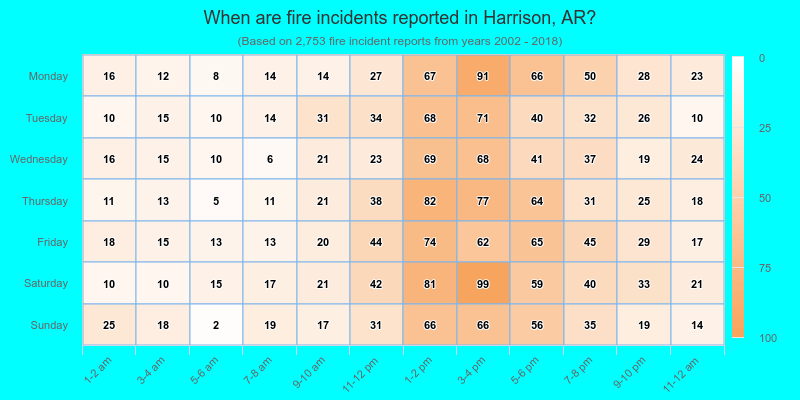
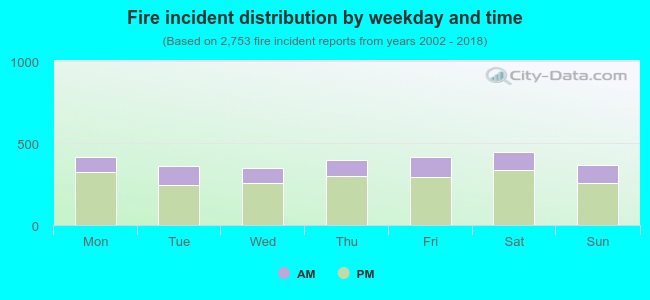 27.1% incidents where reported in the morning and 72.9% in the evening. The most fires (16.3%) took place on Saturday, and the least (12.7%) on Wednesday.
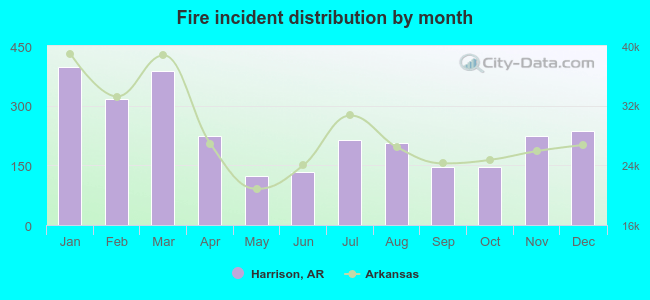 According to the 2,753 fire incidents from years 2002 - 2018 most fires (14.4%) took place during January, and the least (4.5%) in May.
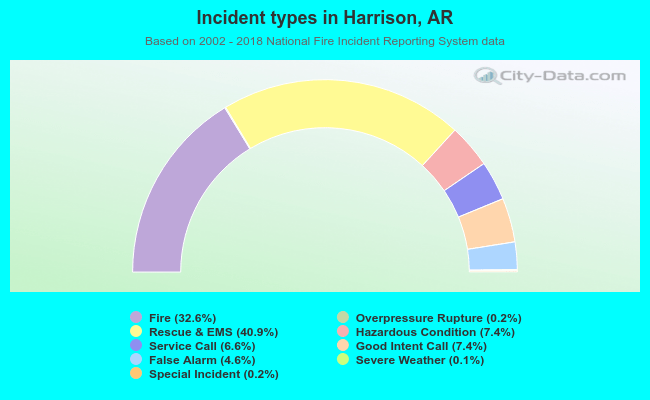 Out of all 8,452 cases reported during the years 2002 - 2018, the most belonged to the categories: Rescue & EMS (40.9%), Fire (32.6%), and Good Intent Call (7.4%).
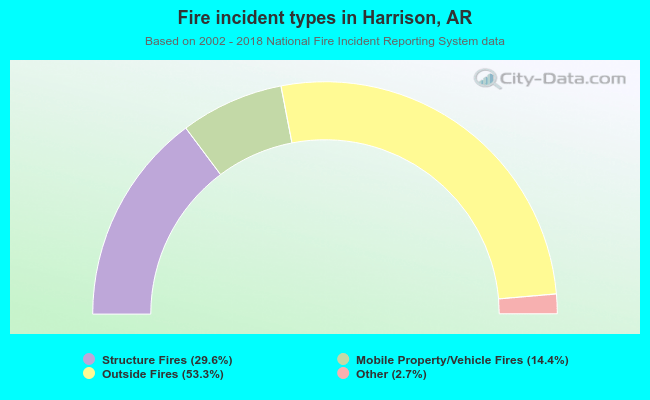 When looking into fire subcategories, the most incidents belonged to: Outside Fires (53.3%), and Structure Fires (29.6%).