| Fire incidents reported |
|---|
| Sreet name | Count |
|---|
| STATE RD 46 | 26 | | 200 N | 6 | | EAST ST | 6 | | STATE ROAD 46 | 6 | | 500 N | 4 | | COUNTY ROAD 1000 | 4 | | HARRISON | 4 | | JACKSON ST | 4 | | JEFFERSON | 4 | | 1 MILE WEST OF ST ROAD 46 | 2 | | 1000 EAST | 2 | | 1050 E | 2 | | 1125 EAST | 2 | | 1140 E | 2 | | 1150 E | 2 | | 1175 E | 2 | | 1175 E COUNTY RD | 2 | | 140 NORTH EAST STREET | 2 | | 1403 EAST ST RD 46 | 2 | | 158 SOUTH 1000 EAST TAL | 2 | | 16201 EAST ST ROAD 46 | 2 | | 17501 E 400 NORTH | 2 | | 17917EAST ST ROAD 46 | 2 | | 200 WEST STREET | 2 | | 20302 EAST 500 NORTH | 2 |
| | | Fire incidents reported |
|---|
| Sreet name | Count |
|---|
| 225 | 2 | | 225 N | 2 | | 230 NORTH WASHINGTO N STR | 2 | | 25 TH STREET | 2 | | 300 | 2 | | 300 NORTH | 2 | | 315 EAST STREET | 2 | | 325 SOUTH JACKSON STREET AVE | 2 | | 3727N 1050 EAST | 2 | | 3800 ??NEWBURN RD | 2 | | 385 E NORTH STREET | 2 | | 385 EAST NORTH STREET | 2 | | 400 SOUTH | 2 | | 4065 NORTH 1050 EAST | 2 | | 4620 NORTH 1125 EAST | 2 | | 4635 N 1000 E | 2 | | 50 | 2 | | 500 E | 2 | | 500 NORTH 17940 EAST | 2 | | 661 EAST 1100 50 NORTH | 2 | | 700 SOUTH | 2 | | 75 | 2 | | 75 SOUTH 900 EAST | 2 | | 8060 NORTH 1150 EAST | 2 | | |
|
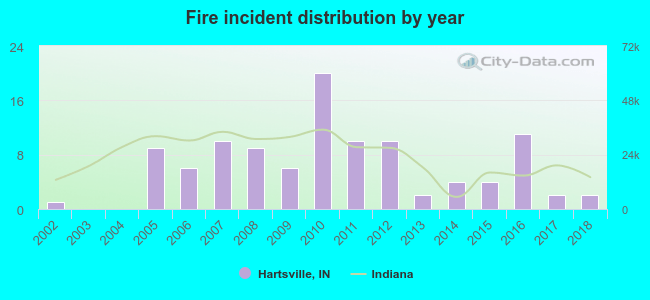 Based on the data from the years 2002 - 2018 the average number of fire incidents per year is 6. The highest number of reported fires - 20 took place in 2010, and the least - 0 in 2003. The data has an increasing trend.
 27.4% incidents where reported in the morning and 72.6% in the evening. The most fires (28.3%) took place on Thursday, and the least (6.6%) on Monday.
 According to the 106 fire incident reports from years 2002 - 2018 most fires (15.1%) took place during November, and the least (1.9%) in July.
 Out of all 431 cases reported during the years 2002 - 2018, the most belonged to the categories: Rescue & EMS (48.7%), Fire (24.6%), and Hazardous Condition (12.5%).
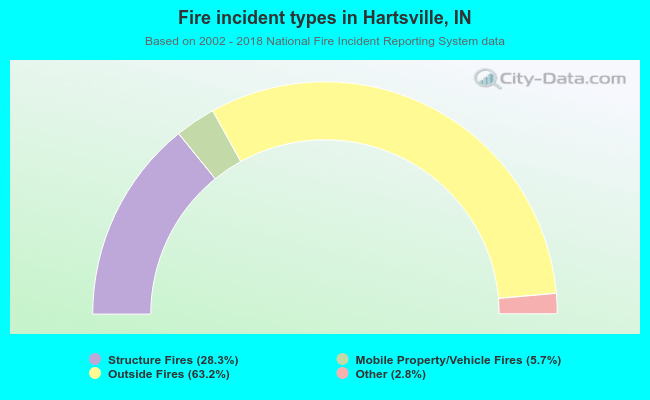 When looking into fire subcategories, the most reports belonged to: Outside Fires (63.2%), and Structure Fires (28.3%).