| Fire incidents reported |
|---|
| Sreet name | Count |
|---|
| 271 RT | 20 | | 1389 RT | 18 | | 2181 RT | 16 | | 69 RT | 14 | | CLAY ST | 14 | | U.S. 60 HWY | 14 | | STATE ROUTE 69 | 10 | | MIDDLE KNOTTSVILLE RD | 8 | | WESCOR RD | 8 | | 9175 STATE ROUTE 144 E | 6 | | FRANKLIN GAYNOR RD | 6 | | HAWES BLVD | 6 | | JENNINGS ST | 6 | | MADISON ST | 6 | | SKYLINE CT | 6 | | STATE ROUTE 1389 | 6 | | STATE ROUTE 2181 | 6 | | STATE ROUTE 271 S | 6 | | TRUMAN YOUNG ROAD | 6 | | 11555 INDIAN HILL RD | 4 | | 1157 STATE ROUTE 144 EAST | 4 | | 12271 HWY 1513 | 4 | | 1240 STATE ROUTE 144 EAST | 4 | | 144 RT | 4 | | 179 ELDER LN. | 4 |
| | | Fire incidents reported |
|---|
| Sreet name | Count |
|---|
| 205 JENNINGS ST. | 4 | | 205 JENNINGS STREET | 4 | | 2255 COAL BANK HOLLOW RD | 4 | | 2302 STATE ROUTE 69 | 4 | | 300 MAIN STREET | 4 | | 3092 RT | 4 | | 3285 STATE ROUTE 144 EAST | 4 | | 334 RT | 4 | | 375 STATE ROUTE 144 WEST | 4 | | 515 PARK ROAD | 4 | | 615 STATE ROUTE 144 WEST | 4 | | 700 WESCOR ROAD | 4 | | 7520 STATE ROUTE 69 | 4 | | 770 STATE ROUTE 144 WEST | 4 | | 850 MOXLEY LN. | 4 | | 8600 STATE ROUTE 2181 | 4 | | 9135 STATE ROUTE 2181 | 4 | | ADAIR RD | 4 | | B. RICE RD | 4 | | FLORAL RD | 4 | | HAPPY HOLLOW RD | 4 | | HAWESVILLE-EASTON RD | 4 | | HWY 1513 | 4 | | INDIAN LAKE DR | 4 | | |
|
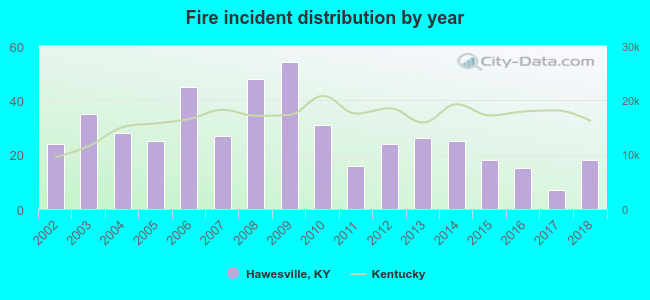 According to the data from the years 2002 - 2018 the average number of fire incidents per year is 27. The highest number of fire incidents - 54 took place in 2009, and the least - 7 in 2017. The data has a decreasing trend.
 30.7% incidents where reported in the morning and 69.3% in the evening. The most fires (16.7%) took place on Tuesday, and the least (12.4%) on Thursday.
 According to the 466 reports from years 2002 - 2018 most fires (14.6%) took place during March, and the least (3.9%) in December.
 Out of all 871 cases reported during the years 2002 - 2018, the most belonged to the categories: Fire (53.5%), Rescue & EMS (23.7%), and Good Intent Call (9.4%).
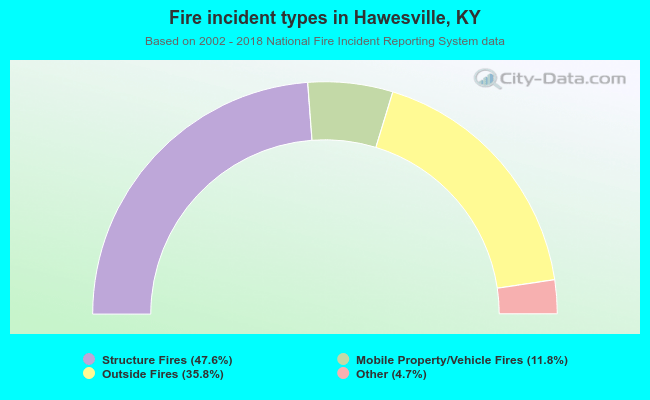 When looking into fire subcategories, the most incidents belonged to: Structure Fires (47.6%), and Outside Fires (35.8%).