Haworth: Fire Incidents, New Jersey (NJ)
Where are fire incidents reported in Haworth, NJ
Something went wrong! Please refresh the page.
|
| |||||||||||||||||||||||||||||||||||||||||||||||||||||||||||||||||||||||||||||||||||||||||||||||||||||||||||||
2003 - 2018 National Fire Incident Reporting System (NFIRS) incidents
- Incident types reported to NFIRS in Haworth, NJ
- 32838.7%Hazardous Condition
- 27232.1%False Alarm
- 15618.4%Fire
- 465.4%Good Intent Call
- 313.7%Service Call
- 80.9%Rescue & EMS
- 30.4%Severe Weather
- 30.4%Special Incident
- 10.1%Overpressure Rupture
- Fire incident types reported to NFIRS in Haworth, NJ
- 9862.8%Structure Fires
- 4428.2%Outside Fires
- 85.1%Other
- 63.8%Mobile Property/Vehicle Fires
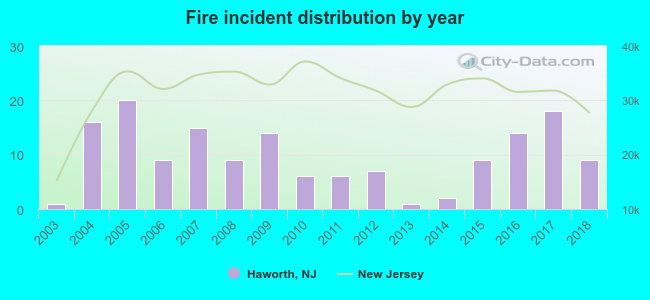 Based on the data from the years 2003 - 2018 the average number of fire incidents per year is 10. The highest number of reported fire incidents - 20 took place in 2005, and the least - 1 in 2003. The data has a growing trend.
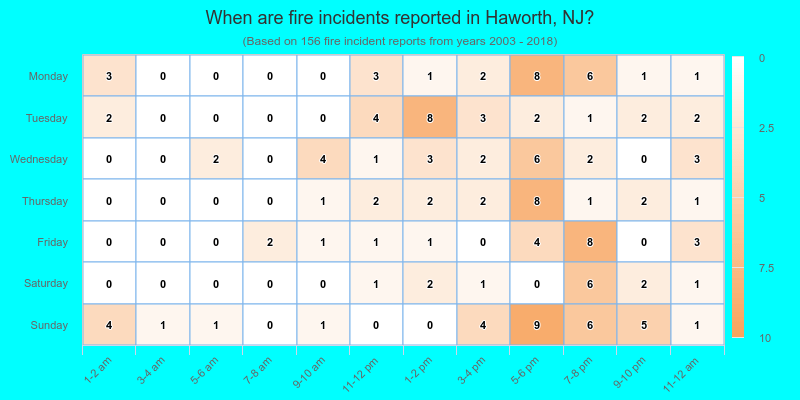
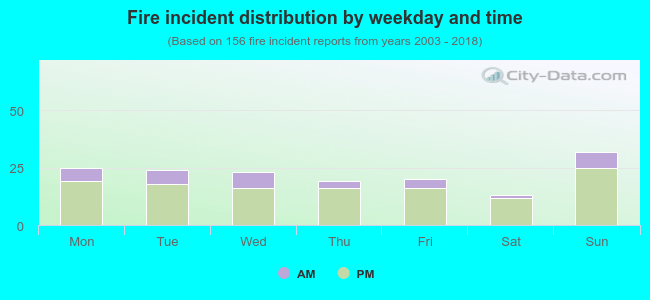 21.8% incidents where reported in the morning and 78.2% in the evening. The most fires (20.5%) took place on Sunday, and the least (8.3%) on Saturday.
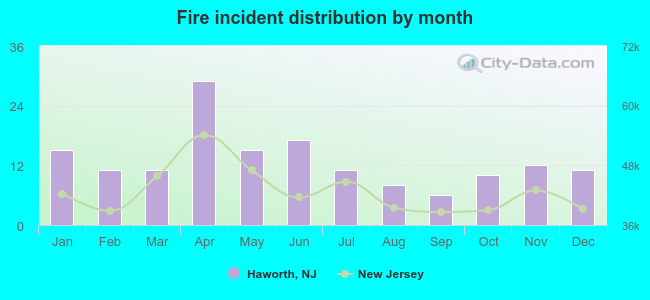 According to the 156 fire incident reports from years 2003 - 2018 most fires (18.6%) took place during April, and the least (3.8%) in September.
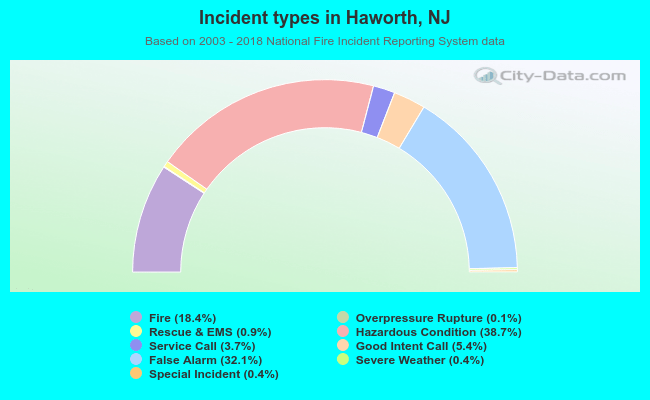 Out of all 848 cases reported during the years 2003 - 2018, the most belonged to the categories: Hazardous Condition (38.7%), False Alarm (32.1%), and Fire (18.4%).
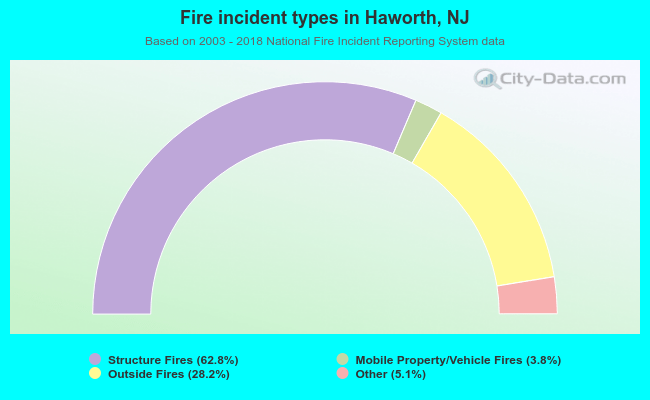 When looking into fire subcategories, the most incidents belonged to: Structure Fires (62.8%), and Outside Fires (28.2%).