Hawthorne: Fire Incidents, Nevada (NV)
Where are fire incidents reported in Hawthorne, NV
Something went wrong! Please refresh the page.
|
| |||||||||||||||||||||||||||||||||||||||||||||||||||||||||||||||||||||||||||||||||||||||||||||||||||||||||||||
2002 - 2018 National Fire Incident Reporting System (NFIRS) incidents
- Incident types reported to NFIRS in Hawthorne, NV
- 1,60473.3%Rescue & EMS
- 27312.5%Fire
- 1456.6%Hazardous Condition
- 843.8%Service Call
- 341.6%False Alarm
- 301.4%Good Intent Call
- 100.5%Special Incident
- 60.3%Severe Weather
- Fire incident types reported to NFIRS in Hawthorne, NV
- 9936.3%Structure Fires
- 7226.4%Outside Fires
- 5319.4%Mobile Property/Vehicle Fires
- 4917.9%Other
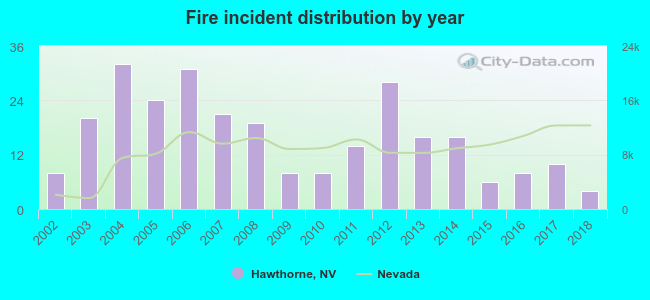 Based on the data from the years 2002 - 2018 the average number of fire incidents per year is 16. The highest number of fire incidents - 32 took place in 2004, and the least - 4 in 2018. The data has a dropping trend.
 37.4% incidents where reported in the morning and 62.6% in the evening. The most fires (17.6%) took place on Monday, and the least (12.1%) on Sunday.
 According to the 273 fire incident reports from years 2002 - 2018 most fires (12.5%) took place during July, and the least (5.1%) in September.
 Out of all 2,187 cases reported during the years 2002 - 2018, the most belonged to the categories: Rescue & EMS (73.3%), Fire (12.5%), and Hazardous Condition (6.6%).
 When looking into fire subcategories, the most reports belonged to: Structure Fires (36.3%), and Outside Fires (26.4%).