| Fire incidents reported |
|---|
| Sreet name | Count |
|---|
| 64 HWY | 42 | | FIRES CREEK RD | 24 | | MCDONALD RD | 16 | | OLD 64 | 16 | | COLD BRANCH RD | 12 | | HWY 64 | 12 | | MYERS CHAPEL RD | 12 | | NC 69 | 12 | | QUALLA RD | 12 | | CHATUGE DAM RD | 10 | | LAUREL BRANCH RD | 10 | | LOW GAP RD | 10 | | TOWN MOUNTAIN RD | 10 | | 175 HWY | 8 | | BUSINESS 64 | 8 | | CHERRY RD | 8 | | HINTON CENTER RD | 8 | | LANCE COVE RD | 8 | | LITTLE OAK DR | 8 | | MATHESON COVE RD | 8 | | TRUETT CAMP RD | 8 | | TUSQUITTEE RD | 8 | | HWY 175 | 6 | | JARRETT RD | 6 | | LOST RIVER TRL | 6 |
| | | Fire incidents reported |
|---|
| Sreet name | Count |
|---|
| MOORE HILL RD | 6 | | MUSKRAT CREEK RD | 6 | | PECKERWOOD RD | 6 | | PRINCE RD | 6 | | VINEYARD RD | 6 | | 1017 LAWRENCE SMITH RD | 4 | | 209 OLD HWY 64 | 4 | | 69 HWY | 4 | | ALBONE TRL | 4 | | ASH BRANCH CIR | 4 | | ASH RD | 4 | | AVERY SCROGGS RD | 4 | | BEAR CUB PATH | 4 | | BLUE RIDGE PARK DR | 4 | | BURNT SCHOOL HOUSE DR | 4 | | CAMEO DR | 4 | | CHAIRMAKER DR | 4 | | CHESTNUT COVE LN | 4 | | COLD BRANCH LN | 4 | | COUNTRY SIDE LN | 4 | | DEERBROOK LN | 4 | | DOWNINGS CREEK RD | 4 | | FIRES CREEK RD | 4 | | GNATTY RD | 4 | | GOSPEL CIR | 4 |
|
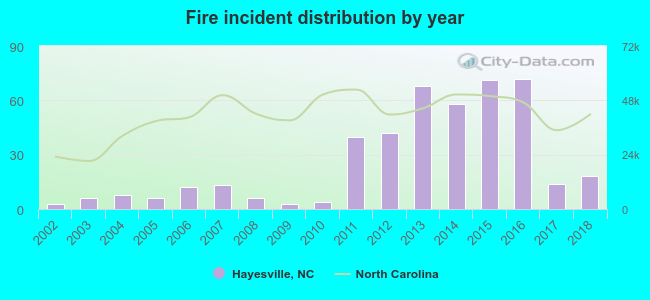 Based on the data from the years 2002 - 2018 the average number of fires per year is 26. The highest number of fires - 72 took place in 2016, and the least - 3 in 2002. The data has a growing trend.
 31.3% incidents where reported in the morning and 68.7% in the evening. The most fires (16.2%) took place on Monday, and the least (10.8%) on Sunday.
 Based on the 444 reports from years 2002 - 2018 most fires (14.6%) took place during February, and the least (4.3%) in October.
 Out of all 3,701 cases reported during the years 2002 - 2018, the most belonged to the categories: Rescue & EMS (57.1%), Good Intent Call (14.4%), and Fire (12.0%).
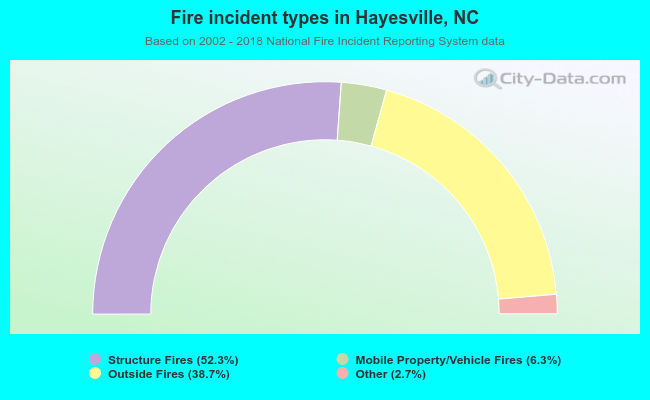 When looking into fire subcategories, the most reports belonged to: Structure Fires (52.3%), and Outside Fires (38.7%).