| Fire incidents reported |
|---|
| Sreet name | Count |
|---|
| U.S. HWY 431 | 80 | | CHURCH ST | 55 | | MAIN ST | 55 | | US HIGHWAY 431 | 50 | | RAILROAD ST | 48 | | COUNTY ROAD 99 | 41 | | TERRACE DR | 39 | | COUNTY ROAD 13 | 34 | | STATE HWY 134 | 30 | | US HWY 431 | 30 | | WILLOW OAKS DR | 25 | | COUNTY ROAD 49 | 20 | | COUNTY ROAD 83 | 20 | | HWY 134 | 20 | | MITCHELL ST | 20 | | WOODS RD | 20 | | COUNTY ROAD 22 | 19 | | AL HWY 134 LGTS | 15 | | BOYNTON ST | 15 | | BRADFORD DR | 15 | | CABLE ST | 15 | | CLEVELAND ST | 15 | | COUNTY ROAD 16 | 15 | | COUNTY ROAD 21 | 15 | | COUNTY ROAD 39 | 15 |
| | | Fire incidents reported |
|---|
| Sreet name | Count |
|---|
| STATE HIGHWAY 134 | 15 | | SUE ELLEN CT | 15 | | HOLLON ST | 14 | | ROCK CREEK RD | 14 | | MAIN CT | 13 | | BARTLETT LOOP | 10 | | BOYTON ST | 10 | | BRADFORD CIR | 10 | | BROAD ST | 10 | | COUNTY ROAD 15 | 10 | | COUNTY ROAD 158 | 10 | | COUNTY ROAD 19 | 10 | | COUNTY ROAD 6 | 10 | | COUNTY ROAD 8 | 10 | | EARLY WALDEN RD | 10 | | EARLY WALDEN ROAD | 10 | | FERN DR | 10 | | FIRST FAMILY DR | 10 | | HAZEL DR | 10 | | KNOWLES RD | 10 | | LINDSEY ST | 10 | | PEACHTREE ST | 10 | | RAILROAD AVE | 10 | | ROBERTS ST | 10 | | BENNETT ST | 9 |
|
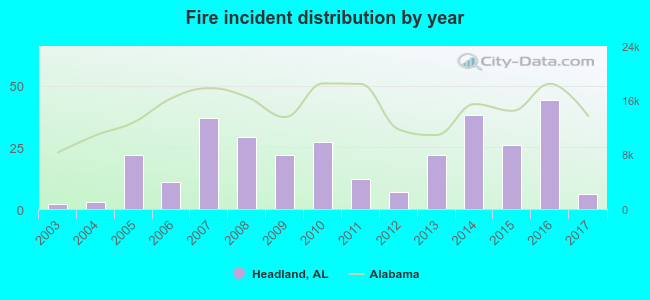 According to the data from the years 2003 - 2017 the average number of fire incidents per year is 21. The highest number of fires - 44 took place in 2016, and the least - 2 in 2003. The data has a rising trend.
 26.9% incidents where reported in the morning and 73.1% in the evening. The most fires (18.2%) took place on Saturday, and the least (9.1%) on Thursday.
 Based on the 308 reports from years 2003 - 2017 most fires (13.0%) took place during January, and the least (3.6%) in September.
 Out of all 2,139 cases reported during the years 2003 - 2017, the most belonged to the categories: Rescue & EMS (63.4%), Fire (14.4%), and Service Call (10.1%).
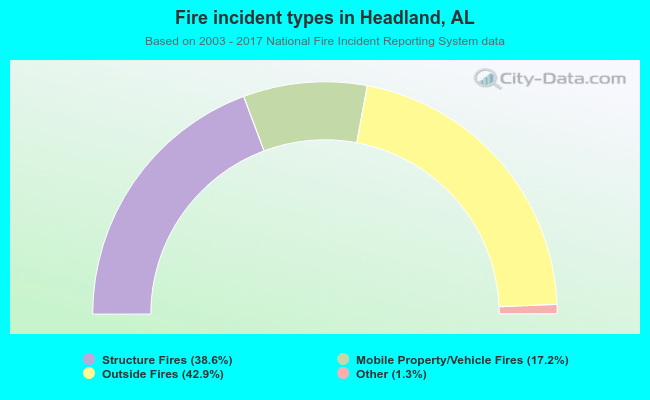 When looking into fire subcategories, the most incidents belonged to: Outside Fires (42.9%), and Structure Fires (38.6%).