Heflin: Fire Incidents, Louisiana (LA)
Where are fire incidents reported in Heflin, LA
Something went wrong! Please refresh the page.
|
| |||||||||||||||||||||||||||||||||||||||||||||||||||||||||||||||||||||||||||||||||||||||||||||||||||||||||||||
2004 - 2018 National Fire Incident Reporting System (NFIRS) incidents
- Incident types reported to NFIRS in Heflin, LA
- 10352.0%Fire
- 2814.1%Service Call
- 2713.6%Rescue & EMS
- 168.1%Good Intent Call
- 105.1%Hazardous Condition
- 94.5%False Alarm
- 52.5%Severe Weather
- Fire incident types reported to NFIRS in Heflin, LA
- 5856.3%Outside Fires
- 3534.0%Structure Fires
- 76.8%Mobile Property/Vehicle Fires
- 32.9%Other
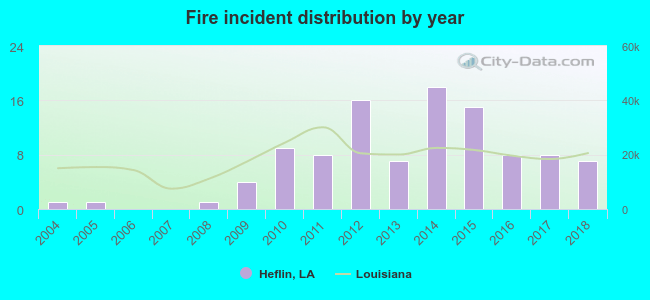 Based on the data from the years 2004 - 2018 the average number of fire incidents per year is 7. The highest number of reported fires - 18 took place in 2014, and the least - 0 in 2006. The data has a rising trend.
 22.3% incidents where reported in the morning and 77.7% in the evening. The most fires (17.5%) took place on Monday, and the least (8.7%) on Thursday.
 Based on the 103 fire incident reports from years 2004 - 2018 most fires (14.6%) took place during October, and the least (2.9%) in November.
 Out of all 198 cases reported during the years 2004 - 2018, the most belonged to the categories: Fire (52.0%), Hazardous Condition (14.1%), and Overpressure Rupture (13.6%).
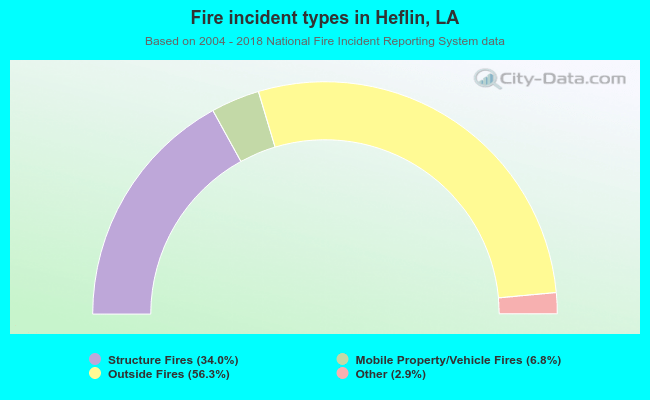 When looking into fire subcategories, the most incidents belonged to: Outside Fires (56.3%), and Structure Fires (34.0%).