Helenwood: Fire Incidents, Tennessee (TN)
Where are fire incidents reported in Helenwood, TN
Something went wrong! Please refresh the page.
|
| |||||||||||||||||||||||||||||||||||||||||||||||||||||||||||||||||||||||||||||||||||||||||||||||||||||||||||||
2004 - 2018 National Fire Incident Reporting System (NFIRS) incidents
- Incident types reported to NFIRS in Helenwood, TN
- 32462.8%Fire
- 11722.7%Hazardous Condition
- 244.7%Service Call
- 214.1%Good Intent Call
- 193.7%Rescue & EMS
- 101.9%False Alarm
- 10.2%Severe Weather
- Fire incident types reported to NFIRS in Helenwood, TN
- 16751.5%Structure Fires
- 11334.9%Outside Fires
- 278.3%Mobile Property/Vehicle Fires
- 175.2%Other
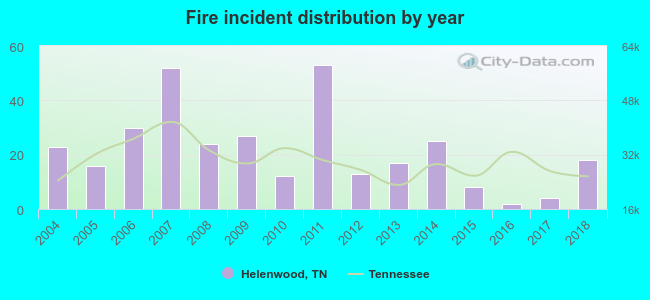 Based on the data from the years 2004 - 2018 the average number of fires per year is 22. The highest number of fire incidents - 53 took place in 2011, and the least - 2 in 2016. The data has a decreasing trend.
 According to the reports from the years 2004 - 2018 the average number of fire-related fatalities per year is 0. The highest number of deaths - 2 took place in 2011, and the lowest - 0 in 2004. The data has a constant trend.
 Based on the data from the years 2004 - 2018 the average number of fire-related casualties per year is 0. The highest number of injuries - 1 took place in 2009, and the lowest - 0 in 2004. The data has a constant trend.
 31.5% incidents where reported in the morning and 68.5% in the evening. The most fires (17.6%) took place on Tuesday, and the least (9.6%) on Thursday.
 According to the 324 fire incidents from years 2004 - 2018 most fires (18.5%) took place during March, and the least (4.9%) in May.
 Out of all 516 cases reported during the years 2004 - 2018, the most belonged to the categories: Fire (62.8%), Rescue & EMS (22.7%), and Hazardous Condition (4.7%).
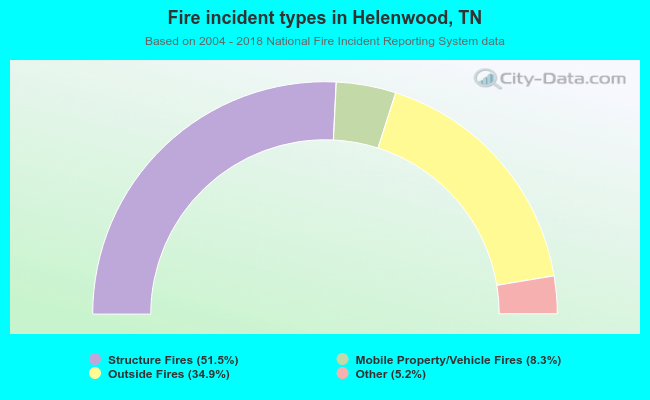 When looking into fire subcategories, the most incidents belonged to: Structure Fires (51.5%), and Outside Fires (34.9%).