| Fire incidents reported |
|---|
| Sreet name | Count |
|---|
| SOUTH MAIN ST | 12 | | 4532 NORTH 2000 WEST | 6 | | DUCHESNE ST | 6 | | FRONTAGE RD & 4TH NO ST | 6 | | JANET ST | 6 | | NORTH ST | 6 | | 1200 W. LINCOLN RD | 4 | | 121 S 200 E | 4 | | 12TH NORTH ST | 4 | | 1927 WEST 4640 NORTH | 4 | | BIRCH ST | 4 | | DEPOT ST | 4 | | E ST | 4 | | GARDEN ST | 4 | | HILL STREET | 4 | | MAIN | 4 | | MAPLE ST | 4 | | MP 2 SPRING GLEN ROAD | 4 | | ROOSEVELT ST | 4 | | SR6 | 4 | | US 6, MP 232.5 HWY | 4 | | 10 E 200 NORTH | 2 | | 10TH NORTH ST | 2 | | 110 4TH AVE | 2 | | 110 W. 400 N. | 2 |
| | | Fire incidents reported |
|---|
| Sreet name | Count |
|---|
| 1190 W. 2210 N | 2 | | 125 DUCHESNE ST | 2 | | 1489 WEST 4200 NORTH | 2 | | 15 NORTH MAIN STREET | 2 | | 156 NORTH MAIN ST | 2 | | 168 DODGE | 2 | | 169 DODGE ST. | 2 | | 178 S MAIN LGTS | 2 | | 178 SOUTH MAIN | 2 | | 1798 W 4200 N ST | 2 | | 1898 WEST 4340 NORTH | 2 | | 1932 WEST 3500 NORTH | 2 | | 1ST AVENUE | 2 | | 1ST WEST (PAVILLION) | 2 | | 20 SPRING CANYON | 2 | | 200 EAST | 2 | | 200 WEST | 2 | | 2000 WEST | 2 | | 2087 NORTH CARBONVILLE ROAD | 2 | | 21 W. 1000 N. | 2 | | 220 RIVER STREET | 2 | | 227 SR6 | 2 | | 2400 N. CARBONVILLE | 2 | | 257 SOUTH 1 WEST | 2 | | |
|
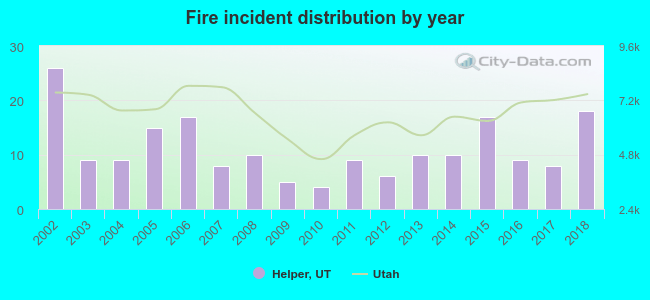 According to the data from the years 2002 - 2018 the average number of fire incidents per year is 11. The highest number of reported fires - 26 took place in 2002, and the least - 4 in 2010. The data has a dropping trend.
 30.0% incidents where reported in the morning and 70.0% in the evening. The most fires (17.9%) took place on Saturday, and the least (9.5%) on Wednesday.
 According to the 190 fire incidents from years 2002 - 2018 most fires (17.9%) took place during July, and the least (3.2%) in December.
 Out of all 1,118 cases reported during the years 2002 - 2018, the most belonged to the categories: Rescue & EMS (69.6%), Fire (17.0%), and Hazardous Condition (8.1%).
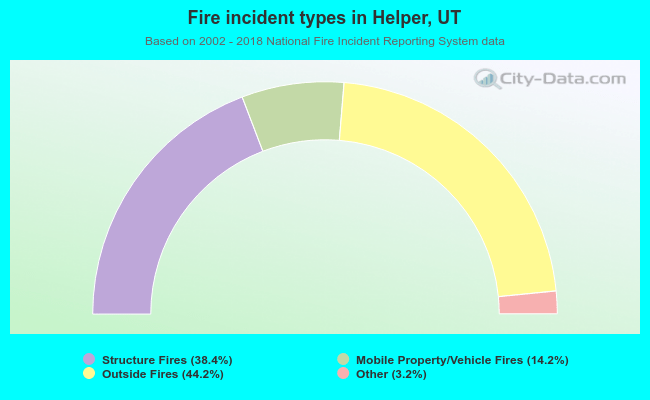 When looking into fire subcategories, the most incidents belonged to: Outside Fires (44.2%), and Structure Fires (38.4%).