| Fire incidents reported |
|---|
| Sreet name | Count |
|---|
| HENDERSON HWY | 78 | | I10 WEST | 62 | | I10 EAST | 54 | | GRAND POINT HWY | 48 | | MELVIN DUPUIS RD | 26 | | NINA HWY | 26 | | I-10 EAST | 22 | | LEBLANC DR | 22 | | GUIDRY RD | 20 | | HENDERSON LEVEE RD | 20 | | HUVAL ST | 16 | | CANAL ST | 14 | | I-10 WEST | 14 | | PATIN ST | 14 | | BOCK HUVAL RD | 12 | | CALISTE OLIVIER RD | 12 | | COURVILLE RD | 12 | | DUPUIS RD | 12 | | BENOIT DR | 10 | | BERNARD ST | 10 | | CHES COURVILLE RD | 10 | | KALLIE ST | 10 | | LELAN RD | 10 | | NORTH BARN RD | 10 | | OLD HENDERSON DR | 10 |
| | | Fire incidents reported |
|---|
| Sreet name | Count |
|---|
| OLD HENDERSON HWY | 10 | | BIJEAUX ST | 8 | | BLANC CORMIER DR | 8 | | COLLETTE ST | 8 | | EVA LN | 8 | | GRAND ANSE HWY | 8 | | GRAND POINTE HWY | 8 | | HUVAL RD | 8 | | MITCHELL BOYER RD | 8 | | PATIN RD | 8 | | ST. PETER ST | 8 | | ALDUS JOHNSON DR | 6 | | AMY ST ST | 6 | | APPLE ST | 6 | | BATISTE ST | 6 | | BUSHVILLE HWY | 6 | | FLO ST | 6 | | FRANK WYATT RD | 6 | | ROBERTSON ST | 6 | | ROY J MELANCON | 6 | | ALDUS CHAMPAGNE DR | 4 | | ANSE BROUSSARD HWY | 4 | | COTTON GIN RD | 4 | | DECLOUET HWY | 4 | | DEVILLIER ST | 4 |
|
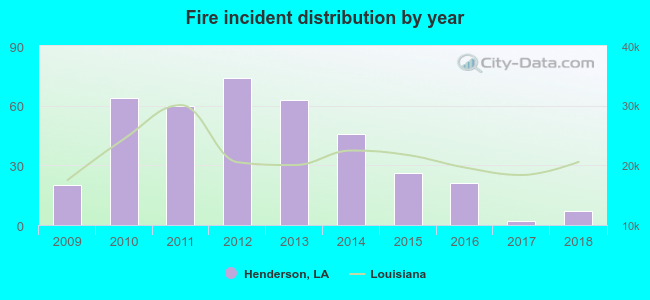 Based on the data from the years 2009 - 2018 the average number of fire incidents per year is 38. The highest number of reported fires - 74 took place in 2012, and the least - 2 in 2017. The data has a declining trend.
 31.5% incidents where reported in the morning and 68.5% in the evening. The most fires (17.7%) took place on Saturday, and the least (9.6%) on Monday.
 Based on the 384 fire incident reports from years 2009 - 2018 most fires (11.7%) took place during January, and the least (3.4%) in September.
 Out of all 641 cases reported during the years 2009 - 2018, the most belonged to the categories: Fire (59.9%), Rescue & EMS (21.8%), and Service Call (15.3%).
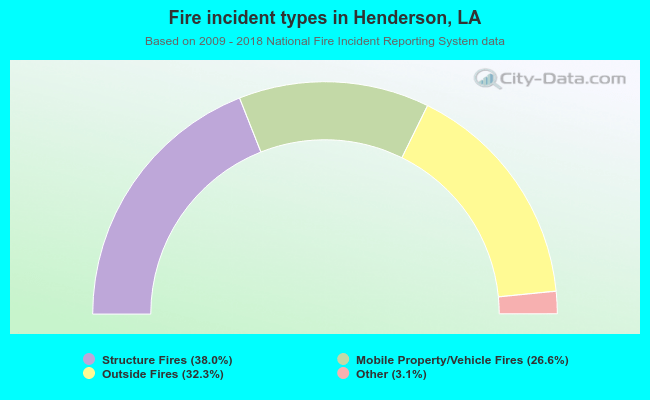 When looking into fire subcategories, the most incidents belonged to: Structure Fires (38.0%), and Outside Fires (32.3%).