Heuvelton: Fire Incidents, New York (NY)
Where are fire incidents reported in Heuvelton, NY
Something went wrong! Please refresh the page.
|
| |||||||||||||||||||||||||||||||||||||||||||||||||||||||||||||||||||||||||||||||||||||||||||||||||||||||||||||
| Other | 78 | |||||||||||||||||||||||||||||||||||||||||||||||||||||||||||||||||||||||||||||||||||||||||||||||||||||||||||||
2002 - 2016 National Fire Incident Reporting System (NFIRS) incidents
- Incident types reported to NFIRS in Heuvelton, NY
- 77051.3%Rescue & EMS
- 38625.7%Fire
- 1197.9%Hazardous Condition
- 1067.1%Service Call
- 614.1%False Alarm
- 483.2%Good Intent Call
- 80.5%Special Incident
- 20.1%Overpressure Rupture
- Fire incident types reported to NFIRS in Heuvelton, NY
- 26769.2%Structure Fires
- 8321.5%Outside Fires
- 246.2%Mobile Property/Vehicle Fires
- 123.1%Other
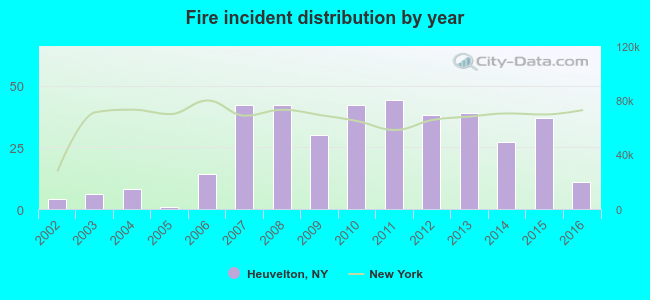 According to the data from the years 2002 - 2016 the average number of fire incidents per year is 26. The highest number of fire incidents - 44 took place in 2011, and the least - 1 in 2005. The data has a growing trend.
 29.3% incidents where reported in the morning and 70.7% in the evening. The most fires (16.6%) took place on Sunday, and the least (12.7%) on Monday.
 According to the 386 incident reports from years 2002 - 2016 most fires (12.4%) took place during April, and the least (5.7%) in August.
 Out of all 1,501 cases reported during the years 2002 - 2016, the most belonged to the categories: Rescue & EMS (51.3%), Fire (25.7%), and Hazardous Condition (7.9%).
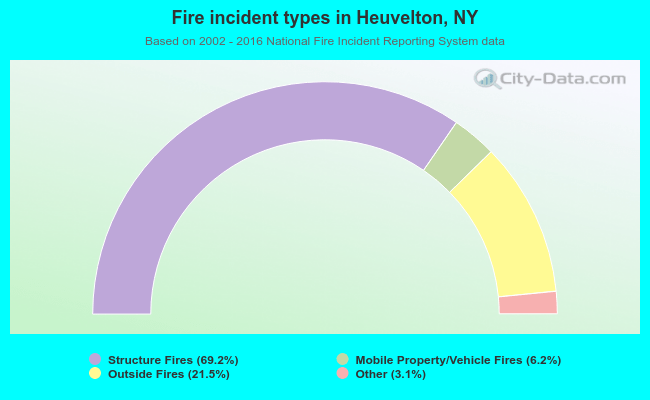 When looking into fire subcategories, the most reports belonged to: Structure Fires (69.2%), and Outside Fires (21.5%).