| Fire incidents reported |
|---|
| Sreet name | Count |
|---|
| CR 231 | 8 | | 609 CEDAR | 6 | | FM 1602 | 6 | | HWY 220 | 6 | | HWY 281 | 6 | | 701 POPULAR | 4 | | CR 214 | 4 | | CR 229 | 4 | | CR 242 | 4 | | ELM STREET | 4 | | FM 1602 AND FM 219 | 4 | | HWY 281 HWY 6 | 4 | | POLK & CHESTNUT | 4 | | POPULAR ST | 4 | | US HIGHWAY 67 | 4 | | WEST ST | 4 | | 1 MILE N OF 281 AND HWY 6 SPLI | 2 | | 1/2 MILE N 281 | 2 | | 1001 KIRK | 2 | | 1001 N KIRK | 2 | | 101 N MESQUITE | 2 | | 1047 CR 132 | 2 | | 106 LAMAR ST | 2 | | 108 CEDAR | 2 | | 112 RD | 2 |
| | | Fire incidents reported |
|---|
| Sreet name | Count |
|---|
| 11580 FM 219 | 2 | | 12 MILE ON CR504 OFF OF CR229 | 2 | | 125 AND 1744 | 2 | | 1251 CR 235 | 2 | | 14870 E FM 219 | 2 | | 15280 HWY 6 | 2 | | 1681 N US HWY 281 | 2 | | 1689 CR 295 | 2 | | 1701 POPLAR ST | 2 | | 1703 CR 499 | 2 | | 1744 IN CARLTON | 2 | | 17800 | 2 | | 17930 N US 281 | 2 | | 1800 CR 271 | 2 | | 1818 CR 211 | 2 | | 1824 AND CR 238 | 2 | | 1824 FM | 2 | | 18625 FM 1602 | 2 | | 1975 CR 121 | 2 | | 1ST STREET | 2 | | 1ST STREET AND PECAN | 2 | | 2 MILES DOWN 281 NORTH OF OLIN | 2 | | 2 ND | 2 | | 201 AVE A | 2 | | |
|
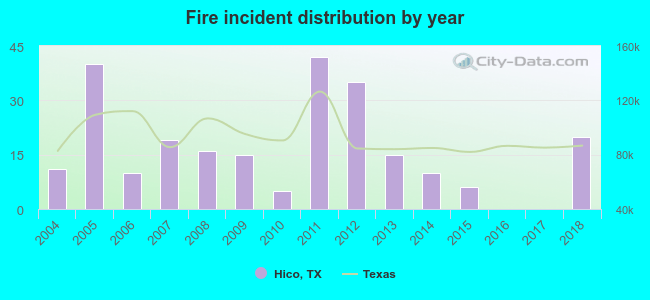 Based on the data from the years 2004 - 2018 the average number of fires per year is 16. The highest number of reported fire incidents - 42 took place in 2011, and the least - 0 in 2016. The data has a rising trend.
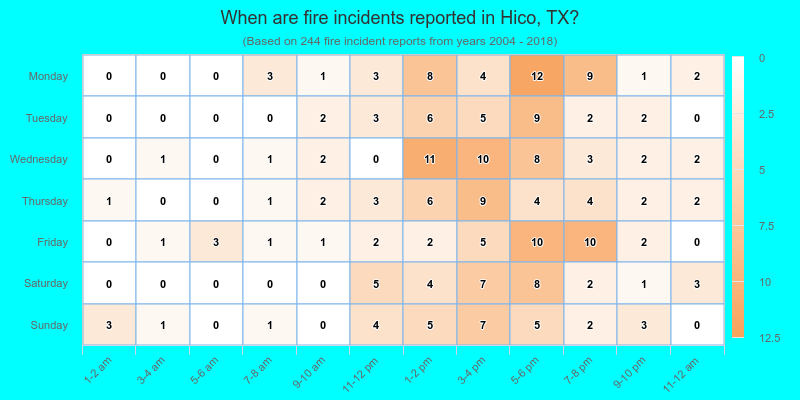
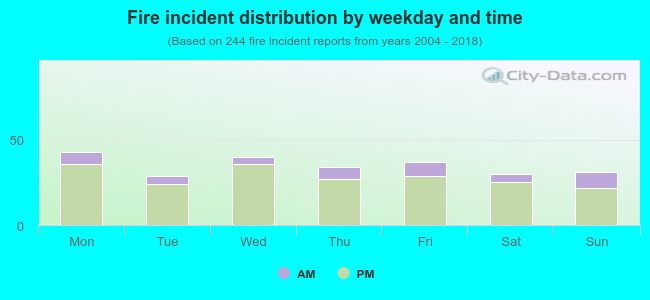 18.4% incidents where reported in the morning and 81.6% in the evening. The most fires (17.6%) took place on Monday, and the least (11.9%) on Tuesday.
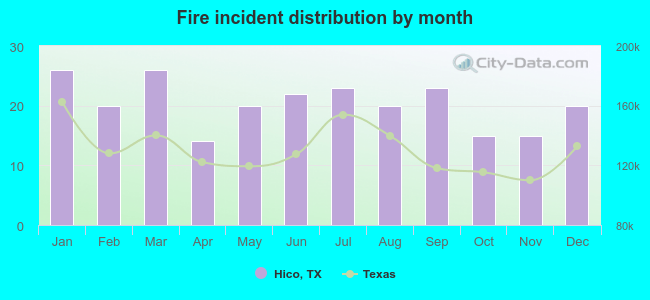 Based on the 244 incident reports from years 2004 - 2018 most fires (10.7%) took place during January, and the least (5.7%) in April.
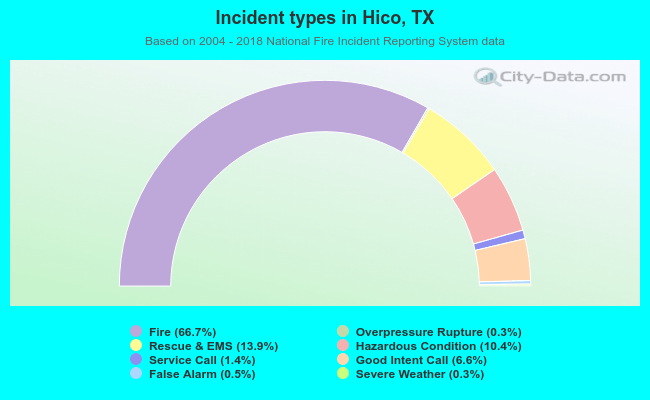 Out of all 366 cases reported during the years 2004 - 2018, the most belonged to the categories: Fire (66.7%), Rescue & EMS (13.9%), and Hazardous Condition (10.4%).
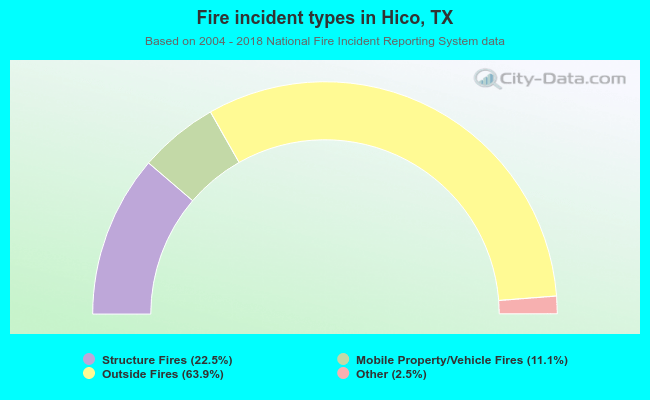 When looking into fire subcategories, the most incidents belonged to: Outside Fires (63.9%), and Structure Fires (22.5%).