| Fire incidents reported |
|---|
| Sreet name | Count |
|---|
| KILLINGWORTH ROAD HWY | 64 | | CANDLEWOOD HILL RD | 28 | | LITTLE CITY ROAD | 26 | | EXITS 9 & 10 | 22 | | CANDLEWOOD HILL ROAD | 20 | | POKORNY ROAD | 20 | | SAYBROOK ROAD HWY | 20 | | WIESE ALBERT ROAD | 16 | | FOOT HILLS ROAD | 14 | | HIDDEN LAKE ROAD | 14 | | OLD COUNTY ROAD | 14 | | DUBLIN HILL ROAD | 10 | | SAYBROOK RD | 10 | | SAYBROOK ROAD | 10 | | SAYBROOK ROAD HIG | 10 | | BRAINARD HILL ROAD | 8 | | BURR RD | 8 | | CHRISTIAN HILL RD | 8 | | COUNTRY WALK | 8 | | MORRIS HUBBARD ROAD | 8 | | BEAVER MEADOW ROAD, HIG | 6 | | CHRISTIAN HILL ROAD | 6 | | DEPOT ROAD | 6 | | GUNGER HILL ROAD | 6 | | HIGH STREET RD | 6 |
| | | Fire incidents reported |
|---|
| Sreet name | Count |
|---|
| HUBBARD ROAD | 6 | | LAUREL GROVE DRIVE | 6 | | LITTLE CITY RD | 6 | | MAPLE AVE. | 6 | | MAPLE AVE., WEST | 6 | | MCTIGH ROAD | 6 | | OXBOW ROAD | 6 | | ROUTE 154 HWY | 6 | | SILVER SPRINGS RD | 6 | | ARKAY DRIVE | 4 | | BARTMAN ROAD | 4 | | BEAVER MEADOW ROAD | 4 | | CHAMBERLIAN HILL ROAD | 4 | | EXITS 10 AND 9 | 4 | | EXITS 8 & 9 | 4 | | FOOT HILLS RD | 4 | | FOREST RIDGE RD | 4 | | FOXGLOVE CIRCLE | 4 | | GRAPEVINE ROAD | 4 | | HIDDEN LAKE RD | 4 | | LT SHAUBAEL RD | 4 | | MAPLE AVE | 4 | | MOTTLAND ROAD | 4 | | NEDOBITY ROAD | 4 | | |
|
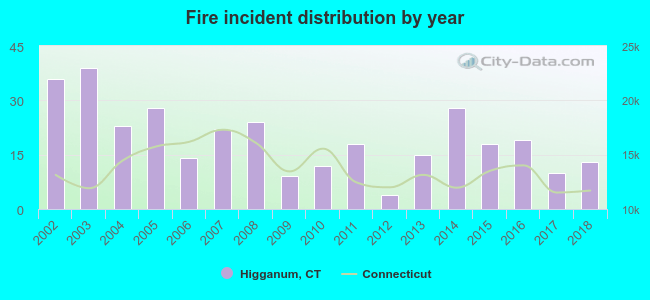 Based on the data from the years 2002 - 2018 the average number of fire incidents per year is 20. The highest number of reported fire incidents - 39 took place in 2003, and the least - 4 in 2012. The data has a dropping trend.
 29.8% incidents where reported in the morning and 70.2% in the evening. The most fires (19.3%) took place on Friday, and the least (10.2%) on Thursday.
 According to the 332 incident reports from years 2002 - 2018 most fires (12.0%) took place during January, and the least (5.4%) in August.
 Out of all 2,140 cases reported during the years 2002 - 2018, the most belonged to the categories: Rescue & EMS (49.2%), Hazardous Condition (18.1%), and Fire (15.5%).
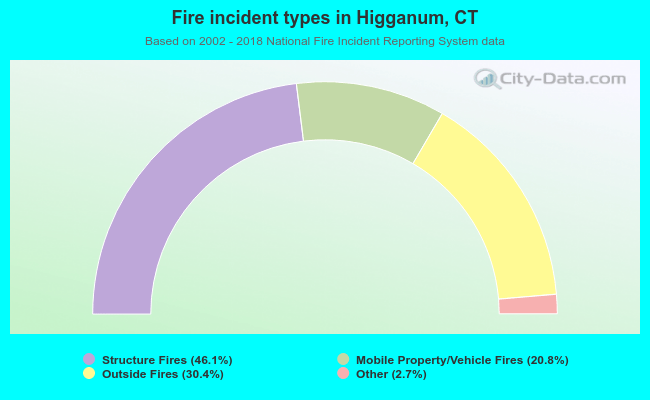 When looking into fire subcategories, the most incidents belonged to: Structure Fires (46.1%), and Outside Fires (30.4%).