High Bridge: Fire Incidents, New Jersey (NJ)
Where are fire incidents reported in High Bridge, NJ
Something went wrong! Please refresh the page.
|
| |||||||||||||||||||||||||||||||||||||||||||||||||||||||||||||||||||||||||||||||||||||||||||||||||||||||||||||
2002 - 2018 National Fire Incident Reporting System (NFIRS) incidents
- Incident types reported to NFIRS in High Bridge, NJ
- 31933.0%Fire
- 31632.6%Hazardous Condition
- 14715.2%Good Intent Call
- 9810.1%False Alarm
- 474.9%Rescue & EMS
- 343.5%Service Call
- 30.3%Special Incident
- 20.2%Overpressure Rupture
- 20.2%Severe Weather
- Fire incident types reported to NFIRS in High Bridge, NJ
- 19260.2%Structure Fires
- 6219.4%Outside Fires
- 4313.5%Other
- 226.9%Mobile Property/Vehicle Fires
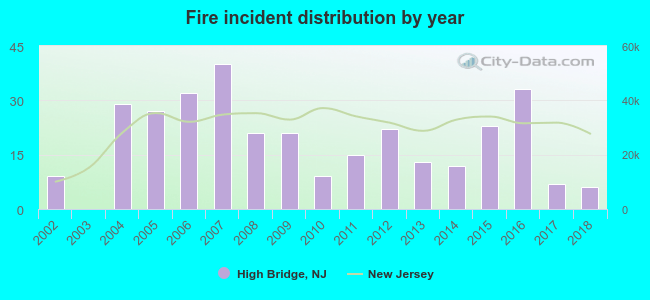 Based on the data from the years 2002 - 2018 the average number of fire incidents per year is 19. The highest number of reported fire incidents - 40 took place in 2007, and the least - 0 in 2003. The data has a dropping trend.
 36.4% incidents where reported in the morning and 63.6% in the evening. The most fires (23.5%) took place on Wednesday, and the least (10.3%) on Friday.
 According to the 319 fire incident reports from years 2002 - 2018 most fires (13.5%) took place during April, and the least (3.1%) in June.
 Out of all 968 cases reported during the years 2002 - 2018, the most belonged to the categories: Fire (33.0%), Hazardous Condition (32.6%), and Good Intent Call (15.2%).
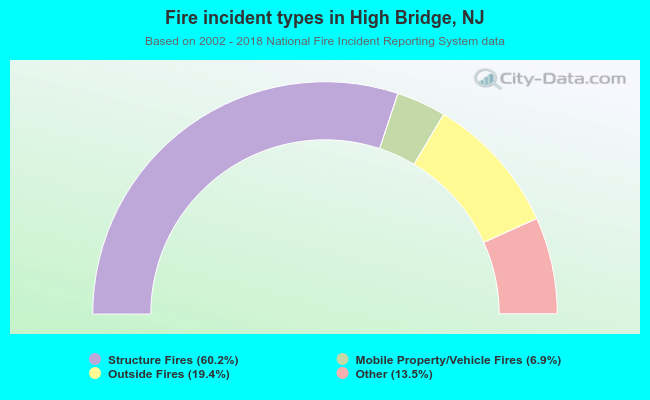 When looking into fire subcategories, the most incidents belonged to: Structure Fires (60.2%), and Outside Fires (19.4%).