Highland: Fire Incidents, California (CA)
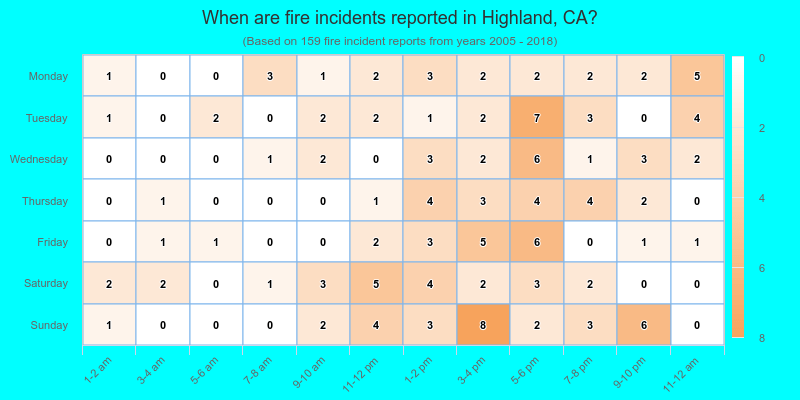
Where are fire incidents reported in Highland, CA
Something went wrong! Please refresh the page.
|
| |||||||||||||||||||||||||||||||||||||||||||||||||||||||||||||||||||||||||||||||||||||||||||||||||||||||||||||
2005 - 2018 National Fire Incident Reporting System (NFIRS) incidents
- Incident types reported to NFIRS in Highland, CA
- 15936.6%Fire
- 13731.6%Good Intent Call
- 7216.6%Rescue & EMS
- 5512.7%Service Call
- 51.2%Hazardous Condition
- 51.2%False Alarm
- 10.2%Special Incident
- Fire incident types reported to NFIRS in Highland, CA
- 8452.8%Structure Fires
- 6138.4%Outside Fires
- 106.3%Mobile Property/Vehicle Fires
- 42.5%Other
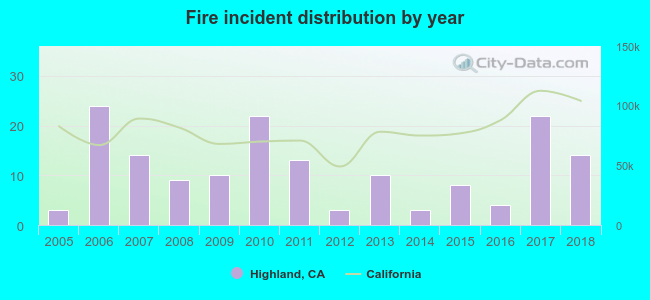 According to the data from the years 2005 - 2018 the average number of fires per year is 11. The highest number of fire incidents - 24 took place in 2006, and the least - 3 in 2005. The data has a rising trend.
The average number of yearly fire incidents per 10k residents in Highland, CA compared to nearest cities:
(Note: Based on data for the last 3 years, including only cities with population 5,000 and above)
| Highland: | 2.4 |
| Redlands: | 34.5 |
| San Bernardino: | 22.7 |
| Loma Linda: | 30.9 |
| Mentone: | 16.8 |
| Colton: | 60.0 |
| Muscoy: | 21.0 |
| Grand Terrace: | 8.3 |
| Lake Arrowhead: | 6.7 |
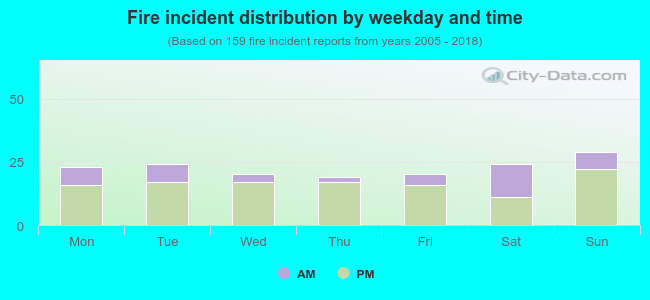 27.0% incidents where reported in the morning and 73.0% in the evening. The most fires (18.2%) took place on Sunday, and the least (11.9%) on Thursday.
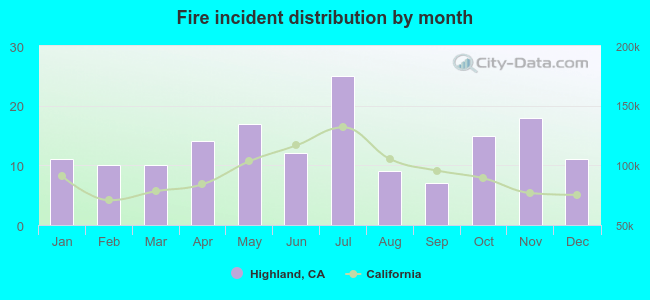 According to the 159 fire incident reports from years 2005 - 2018 most fires (15.7%) took place during July, and the least (4.4%) in September.
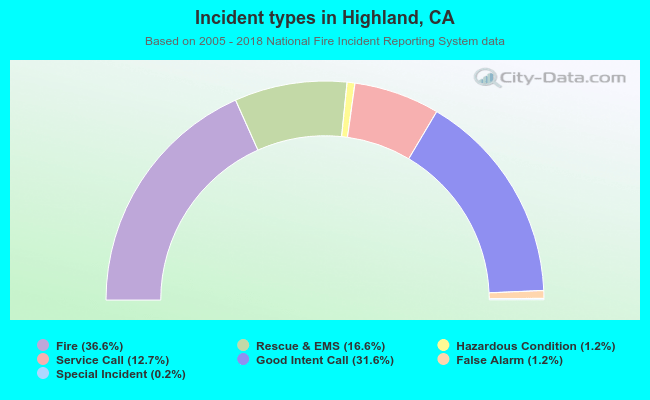 Out of all 434 cases reported during the years 2005 - 2018, the most belonged to the categories: Fire (36.6%), Service Call (31.6%), and Overpressure Rupture (16.6%).
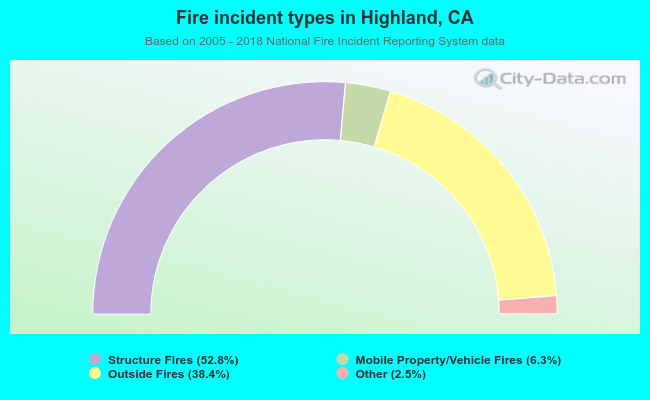 When looking into fire subcategories, the most incidents belonged to: Structure Fires (52.8%), and Outside Fires (38.4%).