Hightstown: Fire Incidents, New Jersey (NJ)
Where are fire incidents reported in Hightstown, NJ
Something went wrong! Please refresh the page.
|
| |||||||||||||||||||||||||||||||||||||||||||||||||||||||||||||||||||||||||||||||||||||||||||||||||||||||||||||
2003 - 2018 National Fire Incident Reporting System (NFIRS) incidents
- Incident types reported to NFIRS in Hightstown, NJ
- 55426.1%False Alarm
- 51724.3%Hazardous Condition
- 43320.4%Fire
- 42119.8%Good Intent Call
- 1346.3%Service Call
- 472.2%Rescue & EMS
- 80.4%Overpressure Rupture
- 80.4%Severe Weather
- 30.1%Special Incident
- Fire incident types reported to NFIRS in Hightstown, NJ
- 31472.5%Structure Fires
- 5312.2%Mobile Property/Vehicle Fires
- 4911.3%Outside Fires
- 173.9%Other
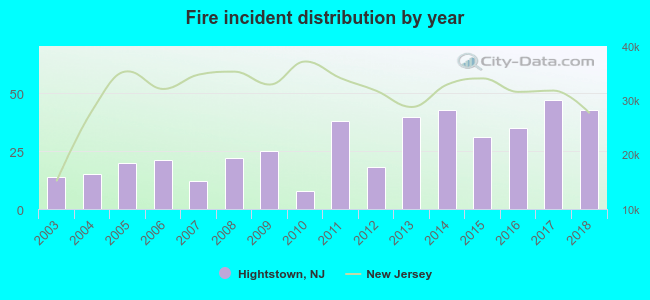 According to the data from the years 2003 - 2018 the average number of fires per year is 27. The highest number of fires - 47 took place in 2017, and the least - 8 in 2010. The data has an increasing trend.
The average number of yearly fire incidents per 10k residents in Hightstown, NJ compared to nearest cities:
(Note: Based on data for the last 3 years, including only cities with population 5,000 and above)
| Hightstown: | 74.8 |
| Jamesburg: | 16.6 |
| Dayton: | 16.0 |
| Princeton: | 24.9 |
| Yardville: | 1.4 |
| Kendall Park: | 7.1 |
| Spotswood: | 16.0 |
| Trenton: | 67.6 |
| East Brunswick: | 18.2 |

 34.2% incidents where reported in the morning and 65.8% in the evening. The most fires (20.1%) took place on Monday, and the least (9.9%) on Thursday.
 Based on the 433 fire incidents from years 2003 - 2018 most fires (10.9%) took place during July, and the least (4.6%) in November.
 Out of all 2,125 cases reported during the years 2003 - 2018, the most belonged to the categories: False Alarm (26.1%), Hazardous Condition (24.3%), and Fire (20.4%).
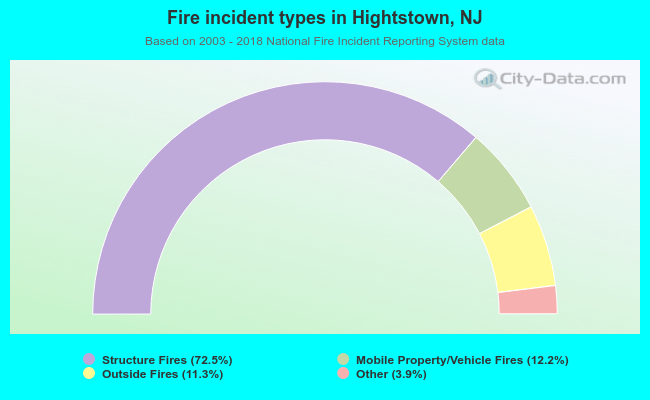 When looking into fire subcategories, the most reports belonged to: Structure Fires (72.5%), and Mobile Property/Vehicle Fires (12.2%).