| Fire incidents reported |
|---|
| Sreet name | Count |
|---|
| HIGHWAY 385 | 10 | | OLD HILL CITY ROAD | 8 | | 16451 SHERIDAN LAKE ROAD | 6 | | HY 385 | 6 | | ROGERS SPRINGS ROAD | 6 | | WEST OF HILL CITY | 6 | | 11321 GILLETTE PRAIRE ROAD | 4 | | 12173 DEERFIELD RD | 4 | | 12325 RAFTER JBAR ROAD | 4 | | 12991 S HY 16 | 4 | | DEERFIELD RD | 4 | | GILLETTE CANYON ROAD | 4 | | HY 16 | 4 | | MYSTIC ROAD | 4 | | OLD HILL CITY RD | 4 | | RENO GULCH RD | 4 | | RENO GULCH RD | 4 | | RENO GULCH ROAD | 4 | | 1 SMOKEY DRIVE | 2 | | 10370711 | 2 | | 11090 DEERFIELD ROAD | 2 | | 11105 DEERFIELD ROAD | 2 | | 11321 GILLETTE PRARIE RD | 2 | | 11515 SLATE PRAIRE ROAD | 2 | | 11705 RENO GULCH ROAD | 2 |
| | | Fire incidents reported |
|---|
| Sreet name | Count |
|---|
| 11749 DEERFIELD ROAD | 2 | | 11773 CASTLE PEAK RD | 2 | | 11779 PROPSECT ROAD | 2 | | 11830 RENO GULCH | 2 | | 11880 MCVEY RD | 2 | | 11880 MCVEY ROAD | 2 | | 12148 GEORGE FRINK ROAD | 2 | | 12169 DEERFIELD ROAD | 2 | | 12173 DEERFIELD ROAD | 2 | | 12278 GOLD MT LOOP | 2 | | 12302 RENO GULCH | 2 | | 12321 RENO GULCH RD | 2 | | 12361 DEERFIELD ROAD | 2 | | 12364 DEERFIELD ROAD | 2 | | 12446 LOG CABIN ROAD | 2 | | 12530 HORSE CREEK ROAD | 2 | | 12534 OLD HILL CITY ROAD | 2 | | 12535 OLD HILL CITY ROAD | 2 | | 12543 OLD HILL CITY ROAD | 2 | | 12620 HY 244 | 2 | | 12626 EDDY LODE RD | 2 | | 12687 SOUTH HIGHWAY 16 | 2 | | 12701 KENNEDYVILLE LOOP | 2 | | 12721 KENNEDY VILLE LOOP | 2 | | |
|
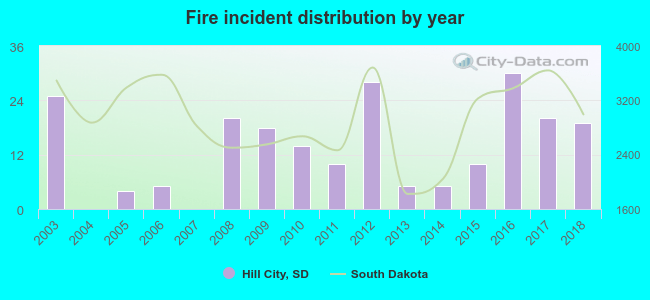 According to the data from the years 2003 - 2018 the average number of fires per year is 13. The highest number of fire incidents - 30 took place in 2016, and the least - 0 in 2004. The data has a declining trend.
 31.9% incidents where reported in the morning and 68.1% in the evening. The most fires (20.2%) took place on Saturday, and the least (9.4%) on Thursday.
 Based on the 213 fire incidents from years 2003 - 2018 most fires (21.1%) took place during July, and the least (4.2%) in February.
 Out of all 1,109 cases reported during the years 2003 - 2018, the most belonged to the categories: Overpressure Rupture (38.4%), Service Call (19.6%), and Fire (19.2%).
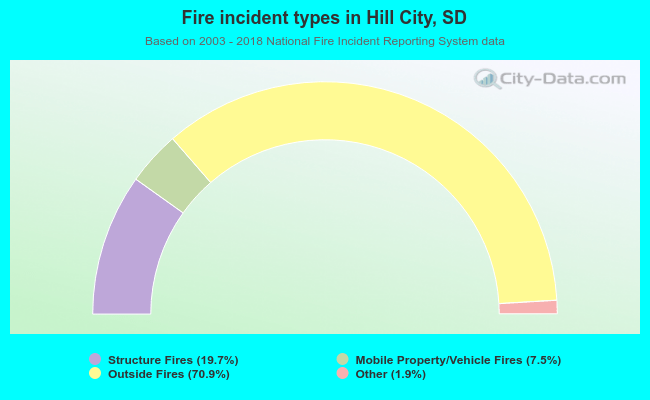 When looking into fire subcategories, the most incidents belonged to: Outside Fires (70.9%), and Structure Fires (19.7%).