| Fire incidents reported |
|---|
| Sreet name | Count |
|---|
| MURRAY HILL RD | 24 | | BOROUGH RD | 16 | | CURRIER RD | 16 | | POVERTY POND RD | 12 | | DEARBORN RD | 10 | | DEARBORN ROAD | 6 | | MURRAY HILL RD | 6 | | MURRAY HILL ROAD | 6 | | NH ROUTE 3A | 6 | | OLD TOWN RD | 6 | | 115 OLD TOWN RD | 4 | | 79 BOOTJACK RD | 4 | | BOROUGH RD | 4 | | CURRIER HILL RD | 4 | | CURRIER HILL RD | 4 | | OLD TOWN RD | 4 | | OLD TOWN ROAD | 4 | | POVERTY POND ROAD | 4 | | QUIMBY RD | 4 | | ROUTE 3A | 4 | | 10TH MOUNTAIN RD | 2 | | 1104 MURRAY HILL RD | 2 | | 12 OLD TOWN RD | 2 | | 133 OLD TOWN RD | 2 | | 137 OLD TOWN RD | 2 |
| | | Fire incidents reported |
|---|
| Sreet name | Count |
|---|
| 15 FERRIN ST | 2 | | 151 BOROUGH RD | 2 | | 16 MT. VIEW DR | 2 | | 164 CLOUGH RD | 2 | | 167 CURRIER RD | 2 | | 195 LYNCH RD | 2 | | 3 TIOGA RD | 2 | | 30 HIGH RIDGE RD | 2 | | 35 EASTSIDE LN | 2 | | 3A RT | 2 | | 4 RANGE RD | 2 | | 43 PARK ST | 2 | | 459 MURRAY HILL RD | 2 | | 48 MT. VIEW DRIV | 2 | | 50 MT VIEW DR | 2 | | 52 FERRIN ST | 2 | | 526 CURRIER RD | 2 | | 571 CURRIER RD | 2 | | 58 NEW CHESTER RD | 2 | | 640 POVERTY POND RD | 2 | | 672 BOROUGH RD | 2 | | AXTEL RD | 2 | | BACK ROAD | 2 | | BARNARD ST | 2 | | |
|
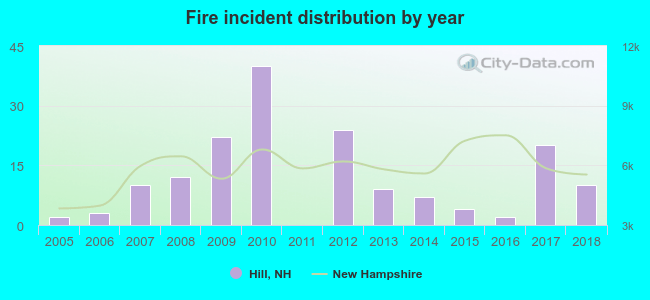 According to the data from the years 2005 - 2018 the average number of fires per year is 12. The highest number of fires - 40 took place in 2010, and the least - 0 in 2011. The data has a rising trend.
 33.3% incidents where reported in the morning and 66.7% in the evening. The most fires (18.2%) took place on Saturday, and the least (11.5%) on Wednesday.
 According to the 165 incident reports from years 2005 - 2018 most fires (26.1%) took place during April, and the least (0.6%) in August.
 Out of all 473 cases reported during the years 2005 - 2018, the most belonged to the categories: Overpressure Rupture (46.7%), Fire (34.9%), and Service Call (7.6%).
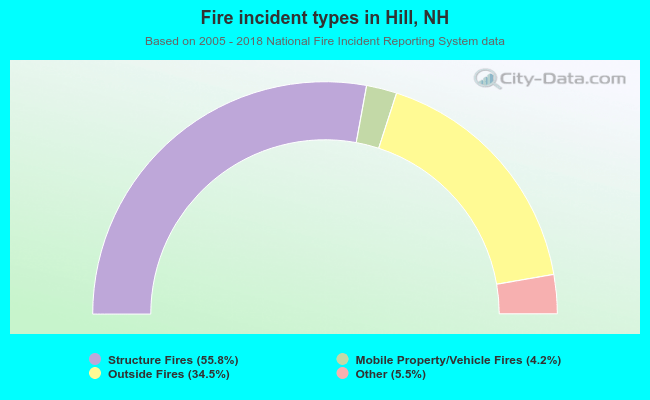 When looking into fire subcategories, the most reports belonged to: Structure Fires (55.8%), and Outside Fires (34.5%).