Hillsboro: Fire Incidents, Kansas (KS)
Where are fire incidents reported in Hillsboro, KS
Something went wrong! Please refresh the page.
|
| |||||||||||||||||||||||||||||||||||||||||||||||||||||||||||||||||||||||||||||||||||||||||||||||||||||||||||||
2002 - 2018 National Fire Incident Reporting System (NFIRS) incidents
- Incident types reported to NFIRS in Hillsboro, KS
- 36544.5%Fire
- 16319.9%Rescue & EMS
- 11814.4%Hazardous Condition
- 9411.4%False Alarm
- 688.3%Good Intent Call
- 101.2%Service Call
- 20.2%Special Incident
- 10.1%Overpressure Rupture
- Fire incident types reported to NFIRS in Hillsboro, KS
- 25670.1%Outside Fires
- 6618.1%Structure Fires
- 359.6%Mobile Property/Vehicle Fires
- 82.2%Other
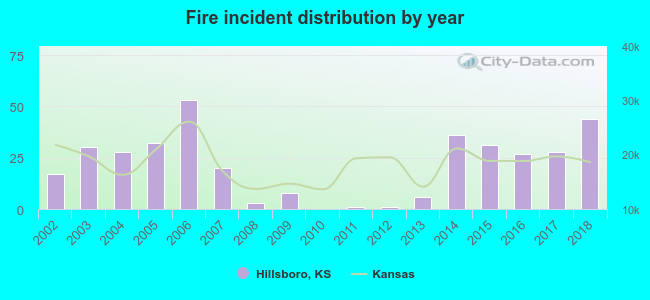 According to the data from the years 2002 - 2018 the average number of fires per year is 21. The highest number of fires - 53 took place in 2006, and the least - 0 in 2010. The data has a growing trend.
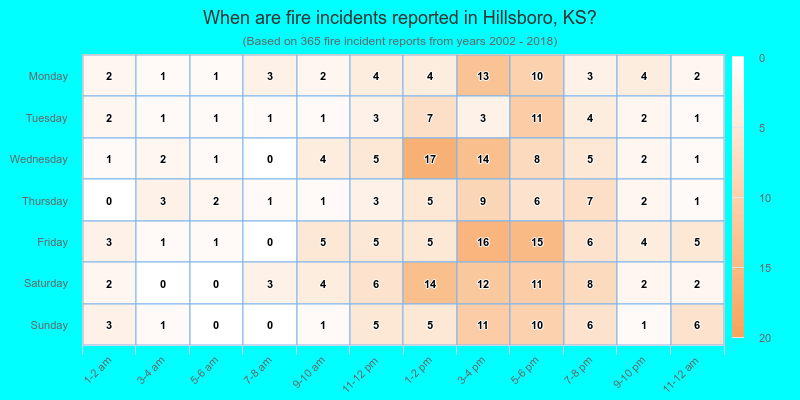
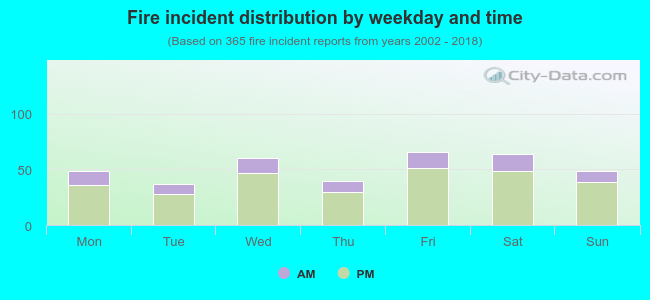 23.3% incidents where reported in the morning and 76.7% in the evening. The most fires (18.1%) took place on Friday, and the least (10.1%) on Tuesday.
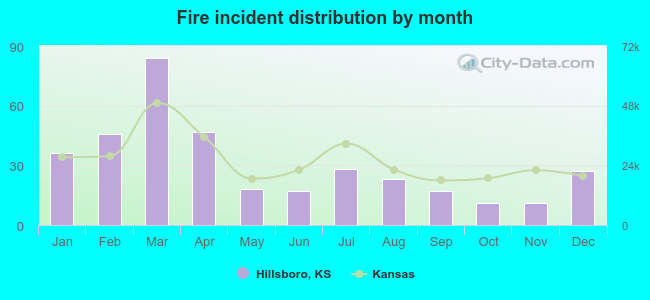 According to the 365 incident reports from years 2002 - 2018 most fires (23.0%) took place during March, and the least (3.0%) in October.
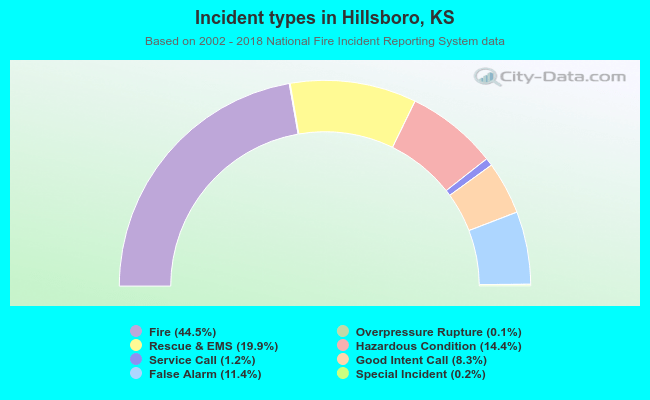 Out of all 821 cases reported during the years 2002 - 2018, the most belonged to the categories: Fire (44.5%), Rescue & EMS (19.9%), and Hazardous Condition (14.4%).
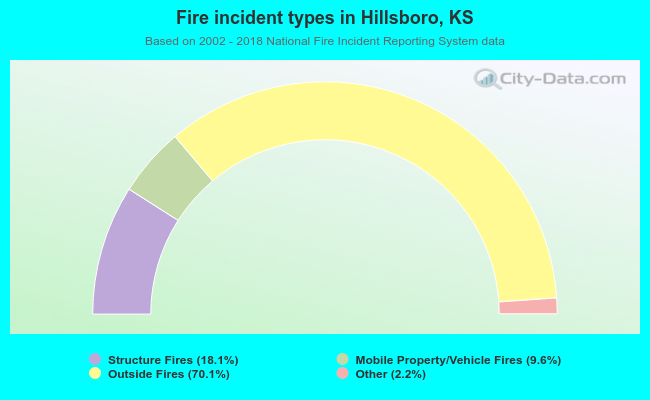 When looking into fire subcategories, the most incidents belonged to: Outside Fires (70.1%), and Structure Fires (18.1%).