Hillsborough: Fire Incidents, New Hampshire (NH)
Where are fire incidents reported in Hillsborough, NH
Something went wrong! Please refresh the page.
|
| |||||||||||||||||||||||||||||||||||||||||||||||||||||||||||||||||||||||||||||||||||||||||||||||||||||||||||||
2008 - 2018 National Fire Incident Reporting System (NFIRS) incidents
- Incident types reported to NFIRS in Hillsborough, NH
- 2,57973.6%Rescue & EMS
- 3068.7%False Alarm
- 2617.4%Hazardous Condition
- 1594.5%Service Call
- 1002.9%Fire
- 1002.9%Good Intent Call
- Fire incident types reported to NFIRS in Hillsborough, NH
- 5656.0%Structure Fires
- 2525.0%Outside Fires
- 1717.0%Mobile Property/Vehicle Fires
- 22.0%Other
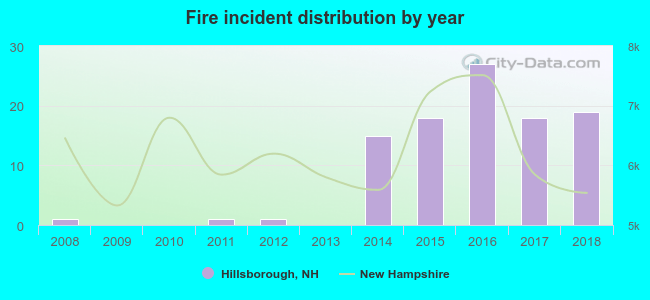 According to the data from the years 2008 - 2018 the average number of fires per year is 9. The highest number of fires - 27 took place in 2016, and the least - 0 in 2009. The data has a rising trend.
 31.0% incidents where reported in the morning and 69.0% in the evening. The most fires (20.0%) took place on Friday, and the least (4.0%) on Monday.
 According to the 100 incident reports from years 2008 - 2018 most fires (19.0%) took place during April, and the least (2.0%) in June.
 Out of all 3,506 cases reported during the years 2008 - 2018, the most belonged to the categories: Rescue & EMS (73.6%), False Alarm (8.7%), and Hazardous Condition (7.4%).
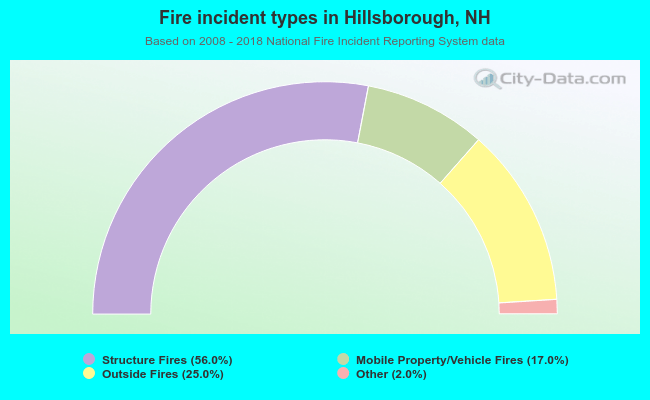 When looking into fire subcategories, the most reports belonged to: Structure Fires (56.0%), and Outside Fires (25.0%).