Hillsdale: Fire Incidents, Kansas (KS)
Where are fire incidents reported in Hillsdale, KS
Something went wrong! Please refresh the page.
|
| |||||||||||||||||||||||||||||||||||||||||||||||||||||||||||||||||||||||||||||||||||||||||||||||||||||||||||||
2002 - 2018 National Fire Incident Reporting System (NFIRS) incidents
- Incident types reported to NFIRS in Hillsdale, KS
- 47756.2%Rescue & EMS
- 15318.0%Fire
- 13415.8%Good Intent Call
- 445.2%Service Call
- 333.9%Hazardous Condition
- 70.8%False Alarm
- 10.1%Overpressure Rupture
- Fire incident types reported to NFIRS in Hillsdale, KS
- 10367.3%Outside Fires
- 2919.0%Structure Fires
- 2113.7%Mobile Property/Vehicle Fires
 According to the data from the years 2002 - 2018 the average number of fires per year is 9. The highest number of fires - 23 took place in 2018, and the least - 2 in 2004. The data has a growing trend.
 20.3% incidents where reported in the morning and 79.7% in the evening. The most fires (23.5%) took place on Thursday, and the least (7.8%) on Monday.
 According to the 153 incident reports from years 2002 - 2018 most fires (24.8%) took place during March, and the least (2.6%) in September.
 Out of all 849 cases reported during the years 2002 - 2018, the most belonged to the categories: Rescue & EMS (56.2%), Fire (18.0%), and Good Intent Call (15.8%).
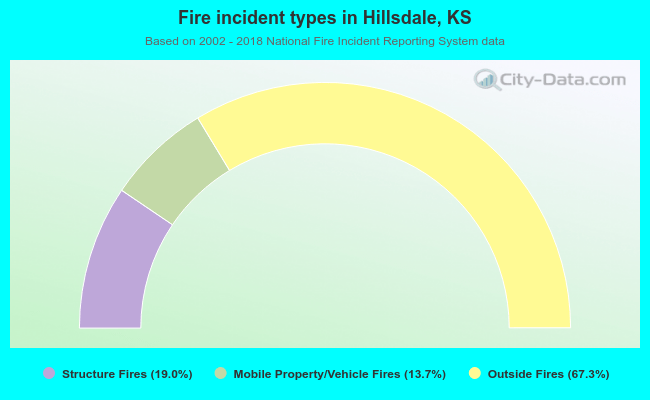 When looking into fire subcategories, the most incidents belonged to: Outside Fires (67.3%), and Structure Fires (19.0%).