| Fire incidents reported |
|---|
| Sreet name | Count |
|---|
| STATE ROUTE 22 HWY | 62 | | STATE ROUTE 23 HWY | 30 | | COLLINS ST | 12 | | COUNTY ROUTE 21 RD | 12 | | HUNT RD | 12 | | MITCHELL ST | 12 | | WOLF HILL RD | 12 | | SCHOOL RD | 10 | | BREEZY HILL RD | 8 | | DAWSON RD | 8 | | BUSHNELL RD | 6 | | HOLM RD | 6 | | MANSFIELD RD | 6 | | OLD ROUTE 22 RD | 6 | | OVERLOOK DR | 6 | | OVERLOOK RD | 6 | | STATE ROUTE 23 RT | 6 | | UNDERHILL RD | 6 | | YONDERVIEW RD | 6 | | BLACK GROCERY RD | 4 | | CASO LA | 4 | | COLLINS STREET EXT | 4 | | GELLERT RD | 4 | | GREEN RIVER LA | 4 | | GREEN RIVER LANE | 4 |
| | | Fire incidents reported |
|---|
| Sreet name | Count |
|---|
| HARLEMVILLE RD | 4 | | SEKONK RD | 4 | | SHUN PIKE RD | 4 | | WILLOW BROOK RD | 4 | | 22 RT | 2 | | ANTHONY ST | 2 | | BUSHNELL RD | 2 | | COOL TIMBER ROAD | 2 | | COTTONWOOD CIR | 2 | | COUNTY ROUTE 17 | 2 | | COUNTY ROUTE 21 RT | 2 | | COUNTY ROUTE 7D RT | 2 | | COUNTY RTE 7D | 2 | | DUGWAY ROAD | 2 | | GILBERT ST | 2 | | GREAT SPRUCE LA | 2 | | HARDER RD. | 2 | | HARLEMVILLE ROAD RD | 2 | | HENICH LA | 2 | | HILLSDALE NEIGHBORS | 2 | | HILLSIDE RD | 2 | | HOLM ROAD RD | 2 | | MANSFIELD RD | 2 | | MEADOW LA | 2 | | NORTH MOUNTAIN ROAD RD | 2 |
|
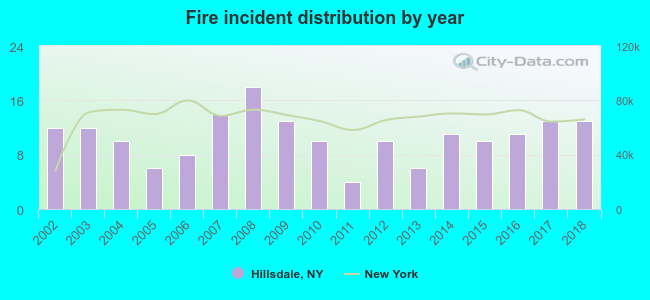 According to the data from the years 2002 - 2018 the average number of fires per year is 11. The highest number of reported fires - 18 took place in 2008, and the least - 4 in 2011. The data has an increasing trend.
 29.3% incidents where reported in the morning and 70.7% in the evening. The most fires (18.8%) took place on Tuesday, and the least (9.9%) on Wednesday.
 According to the 181 fire incidents from years 2002 - 2018 most fires (21.0%) took place during April, and the least (3.3%) in November.
 Out of all 921 cases reported during the years 2002 - 2018, the most belonged to the categories: Hazardous Condition (34.5%), False Alarm (20.8%), and Fire (19.7%).
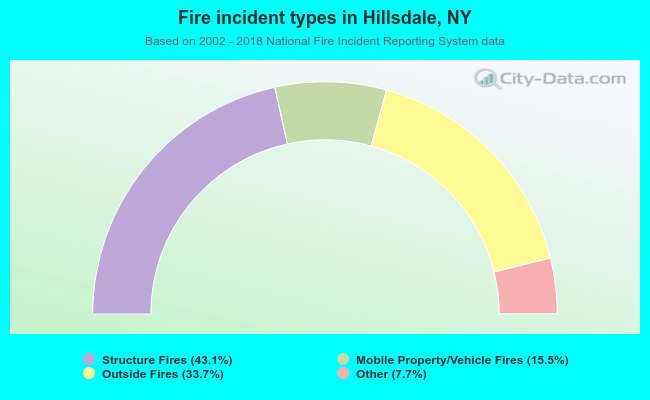 When looking into fire subcategories, the most reports belonged to: Structure Fires (43.1%), and Outside Fires (33.7%).