Ho-Ho-Kus: Fire Incidents, New Jersey (NJ)
Where are fire incidents reported in Ho-Ho-Kus, NJ
Something went wrong! Please refresh the page.
|
| |||||||||||||||||||||||||||||||||||||||||||||||||||||||||||||||||||||||||||||||||||||||||||||||||||||
2003 - 2011 National Fire Incident Reporting System (NFIRS) incidents
- Incident types reported to NFIRS in Ho-Ho-Kus, NJ
- 37865.4%Hazardous Condition
- 10117.5%Fire
- 7813.5%False Alarm
- 111.9%Good Intent Call
- 50.9%Service Call
- 30.5%Rescue & EMS
- 20.3%Severe Weather
- Fire incident types reported to NFIRS in Ho-Ho-Kus, NJ
- 6564.4%Structure Fires
- 2120.8%Outside Fires
- 1514.9%Mobile Property/Vehicle Fires
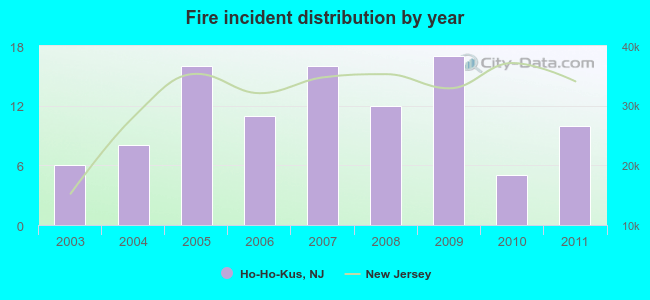 According to the data from the years 2003 - 2011 the average number of fire incidents per year is 11. The highest number of fires - 17 took place in 2009, and the least - 5 in 2010. The data has a growing trend.
 35.6% incidents where reported in the morning and 64.4% in the evening. The most fires (20.8%) took place on Tuesday, and the least (4.0%) on Monday.
 Based on the 101 fire incident reports from years 2003 - 2011 most fires (18.8%) took place during December, and the least (4.0%) in August.
 Out of all 578 cases reported during the years 2003 - 2011, the most belonged to the categories: Rescue & EMS (65.4%), Fire (17.5%), and Good Intent Call (13.5%).
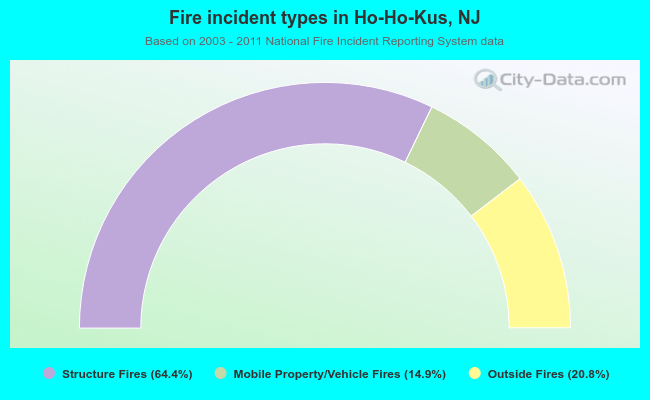 When looking into fire subcategories, the most incidents belonged to: Structure Fires (64.4%), and Outside Fires (20.8%).