Hobe Sound: Fire Incidents, Florida (FL)
Where are fire incidents reported in Hobe Sound, FL
Something went wrong! Please refresh the page.
|
| |||||||||||||||||||||||||||||||||||||||||||||||||||||||||||||||||||||||||||||||||||||||||||||||||||||||||||||
2005 - 2017 National Fire Incident Reporting System (NFIRS) incidents
- Incident types reported to NFIRS in Hobe Sound, FL
- 4,89170.9%Rescue & EMS
- 5017.3%Service Call
- 4726.8%Fire
- 4456.5%Hazardous Condition
- 3755.4%Good Intent Call
- 2043.0%False Alarm
- Fire incident types reported to NFIRS in Hobe Sound, FL
- 29662.7%Outside Fires
- 9620.3%Structure Fires
- 7916.7%Mobile Property/Vehicle Fires
- 10.2%Other
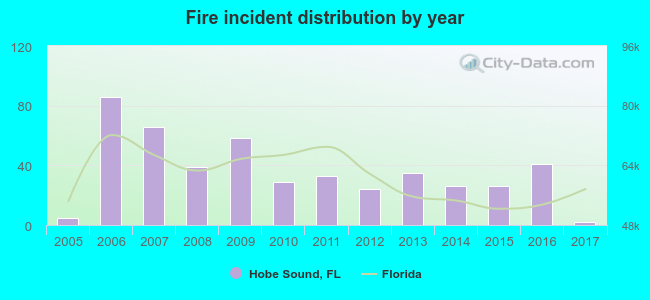 Based on the data from the years 2005 - 2017 the average number of fires per year is 36. The highest number of fires - 86 took place in 2006, and the least - 2 in 2017. The data has a declining trend.
The average number of yearly fire incidents per 10k residents in Hobe Sound, FL compared to nearest cities:
(Note: Based on data for the last 3 years, including only cities with population 5,000 and above)
| Hobe Sound: | 18.7 |
| Port Salerno: | 1.0 |
| Tequesta: | 21.0 |
| Stuart: | 46.7 |
| Palm City: | 21.5 |
| Jupiter: | 3.0 |
| Jensen Beach: | 27.0 |
| Palm Beach Gardens: | 2.0 |
| North Palm Beach: | 17.1 |
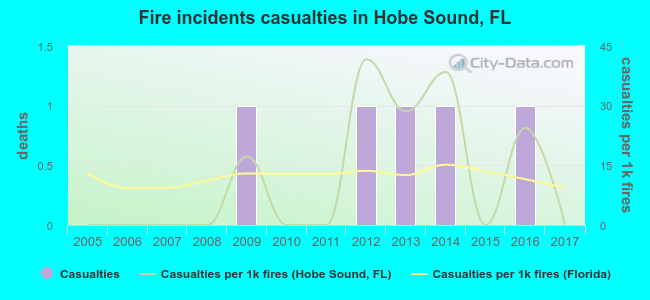 According to the reports from the years 2005 - 2017 the average number of fire-related yearly casualties is 0. The highest number of reported casualties - 1 took place in 2009, and the lowest - 0 in 2005. The data has a constant trend.
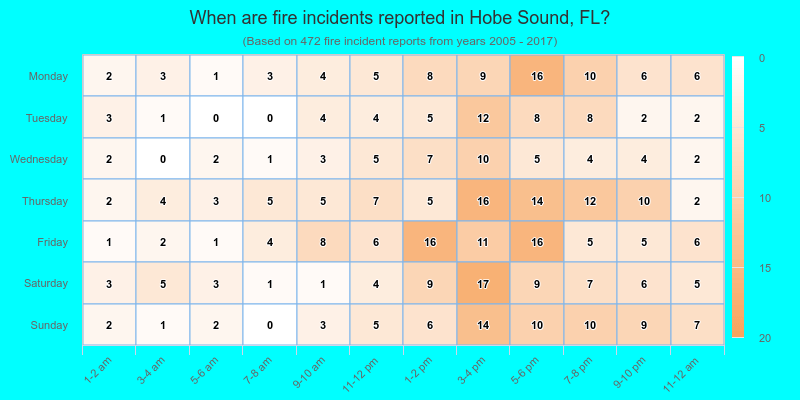
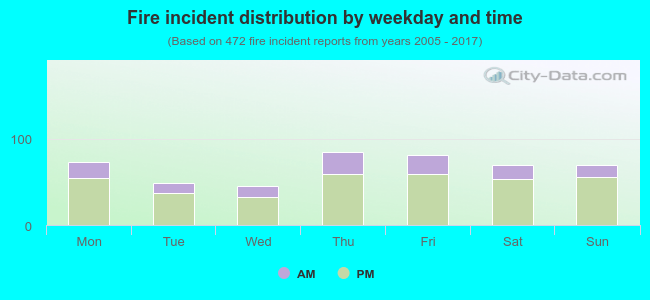 25.6% incidents where reported in the morning and 74.4% in the evening. The most fires (18.0%) took place on Thursday, and the least (9.5%) on Wednesday.
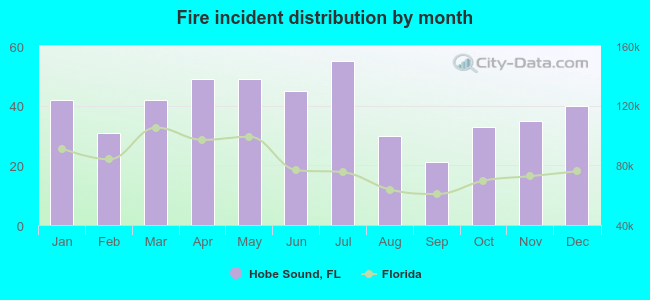 Based on the 472 incident reports from years 2005 - 2017 most fires (11.7%) took place during July, and the least (4.4%) in September.
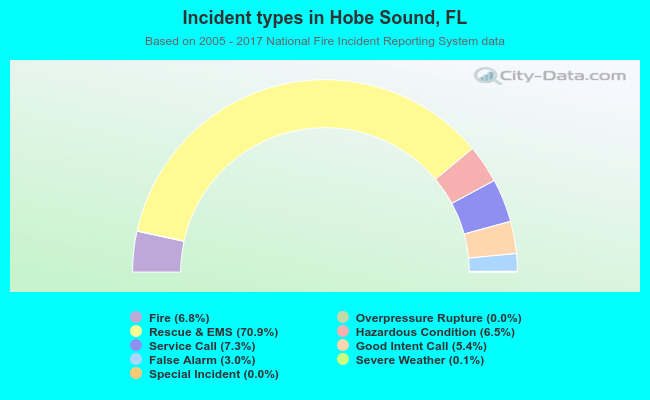 Out of all 6,897 cases reported during the years 2005 - 2017, the most belonged to the categories: Rescue & EMS (70.9%), Service Call (7.3%), and Fire (6.8%).
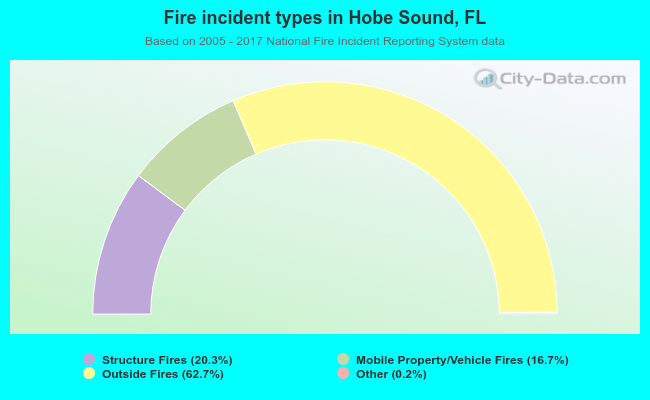 When looking into fire subcategories, the most incidents belonged to: Outside Fires (62.7%), and Structure Fires (20.3%).