Holcomb: Fire Incidents, Kansas (KS)
Where are fire incidents reported in Holcomb, KS
Something went wrong! Please refresh the page.
|
| |||||||||||||||||||||||||||||||||||||||||||||||||||||||||||||||||||||||||||||||||||||||||||||||||||||||||||||
2002 - 2018 National Fire Incident Reporting System (NFIRS) incidents
- Incident types reported to NFIRS in Holcomb, KS
- 32652.3%Fire
- 15825.4%Hazardous Condition
- 497.9%Good Intent Call
- 386.1%False Alarm
- 243.9%Rescue & EMS
- 172.7%Severe Weather
- 101.6%Service Call
- 10.2%Overpressure Rupture
- Fire incident types reported to NFIRS in Holcomb, KS
- 22067.5%Outside Fires
- 6620.2%Structure Fires
- 288.6%Mobile Property/Vehicle Fires
- 123.7%Other
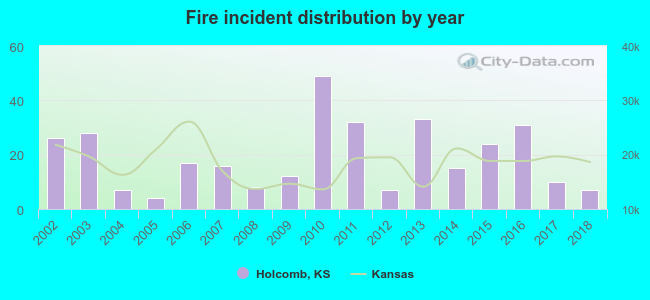 According to the data from the years 2002 - 2018 the average number of fires per year is 19. The highest number of fires - 49 took place in 2010, and the least - 4 in 2005. The data has a dropping trend.
 23.9% incidents where reported in the morning and 76.1% in the evening. The most fires (17.8%) took place on Friday, and the least (12.3%) on Monday.
 According to the 326 incident reports from years 2002 - 2018 most fires (18.7%) took place during July, and the least (4.9%) in December.
 Out of all 623 cases reported during the years 2002 - 2018, the most belonged to the categories: Fire (52.3%), Hazardous Condition (25.4%), and Good Intent Call (7.9%).
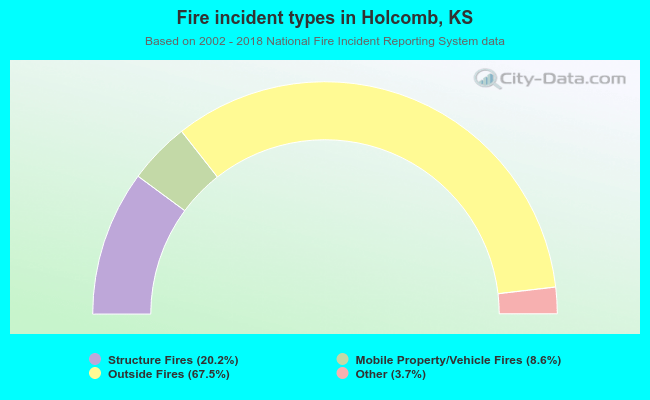 When looking into fire subcategories, the most incidents belonged to: Outside Fires (67.5%), and Structure Fires (20.2%).