Holden Beach: Fire Incidents, North Carolina (NC)
Where are fire incidents reported in Holden Beach, NC
Something went wrong! Please refresh the page.
|
| |||||||||||||||||||||||||||||||||||||||||||||||||||||||||||||||||||||||||
2003 - 2018 National Fire Incident Reporting System (NFIRS) incidents
- Incident types reported to NFIRS in Holden Beach, NC
- 50754.9%Rescue & EMS
- 15616.9%Good Intent Call
- 10311.1%Fire
- 727.8%False Alarm
- 434.7%Service Call
- 384.1%Hazardous Condition
- 50.5%Severe Weather
- Fire incident types reported to NFIRS in Holden Beach, NC
- 7774.8%Structure Fires
- 1413.6%Outside Fires
- 76.8%Mobile Property/Vehicle Fires
- 54.9%Other
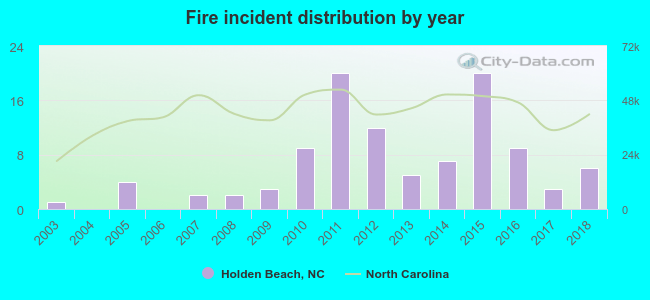 According to the data from the years 2003 - 2018 the average number of fire incidents per year is 6. The highest number of reported fire incidents - 20 took place in 2011, and the least - 0 in 2004. The data has an increasing trend.
 41.7% incidents where reported in the morning and 58.3% in the evening. The most fires (22.3%) took place on Tuesday, and the least (7.8%) on Monday.
 According to the 103 incident reports from years 2003 - 2018 most fires (15.5%) took place during July, and the least (1.9%) in October.
 Out of all 924 cases reported during the years 2003 - 2018, the most belonged to the categories: Overpressure Rupture (54.9%), Service Call (16.9%), and Fire (11.1%).
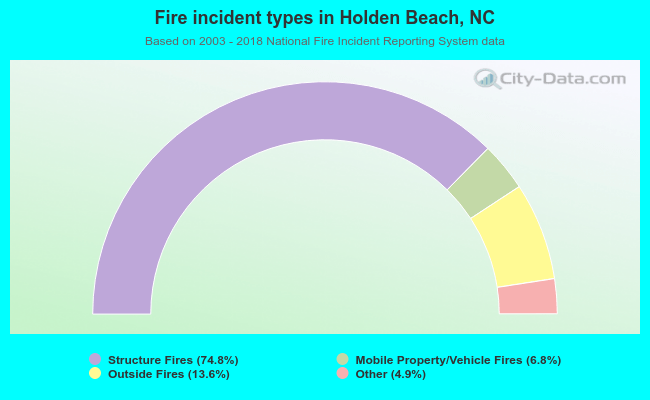 When looking into fire subcategories, the most reports belonged to: Structure Fires (74.8%), and Outside Fires (13.6%).