| Fire incidents reported |
|---|
| Sreet name | Count |
|---|
| 22 MINE ROAD | 20 | | 22 MINE RD | 10 | | COOLIDGE AVE. | 10 | | HOLDEN RD | 10 | | MINE RD | 10 | | SULPHUR SPRINGS | 10 | | 411 LEE AVE. | 8 | | HOLDEN ROAD | 8 | | LEE SUBDIVISION | 8 | | PRICE BOTTOM | 8 | | US 119 | 8 | | 22 MINE RD. | 6 | | DECKER HILL | 6 | | HILLCREST AVE | 6 | | LOGAN AVE | 6 | | PRICE BOTTOM RD | 6 | | SULPHER SPRINGS | 6 | | 211 MERRILL ST. | 4 | | 2ND DAVIS AT 7&8 HOLDEN | 4 | | 399 LEE AVE | 4 | | 408 SYCAMORE CAMP | 4 | | 440 DECKER HILL | 4 | | 7 & 8 HOLDEN | 4 | | BUSINESS PARK DR | 4 | | COPERUS FORK RD. | 4 |
| | | Fire incidents reported |
|---|
| Sreet name | Count |
|---|
| DAVES PIZZA | 4 | | FLASH ALLEY | 4 | | GASTON CAPERTON DR | 4 | | KIMBALL AVE. | 4 | | REGIONAL JAIL | 4 | | ROUTE 44 RD | 4 | | SYCAMORE ST. | 4 | | U S ROUTE 119 | 4 | | WHITMAN EXIT RAMP | 4 | | WHITMAN JUNCTION | 4 | | 119 COUNTY LINE | 2 | | 119 HOLDEN | 2 | | 119 HOLDEN RD | 2 | | 119 N | 2 | | 119 NEAR HAZELWOOD DR | 2 | | 119 SOUTHBOUND WHITMAN JUNCTIO | 2 | | 123 PRICE BOTTOM | 2 | | 133 PRICE BOTTOM RD | 2 | | 138 LEE SUBDIVISION RD | 2 | | 156 HAZELWOOD ROAD | 2 | | 156 HAZELWOOD DR | 2 | | 156 HAZELWOOD DRIVE | 2 | | 1813 COPPERAS FORK ROAD | 2 | | 1ST DAVIS | 2 | | |
|
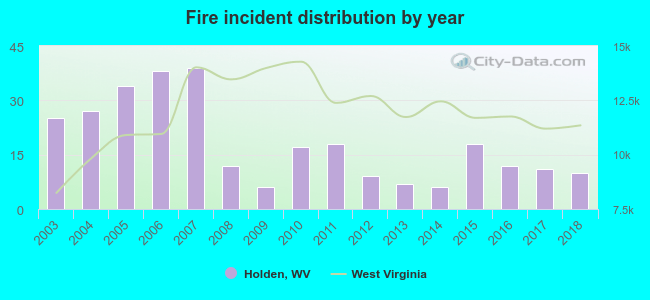 According to the data from the years 2003 - 2018 the average number of fires per year is 18. The highest number of fire incidents - 39 took place in 2007, and the least - 6 in 2009. The data has a declining trend.
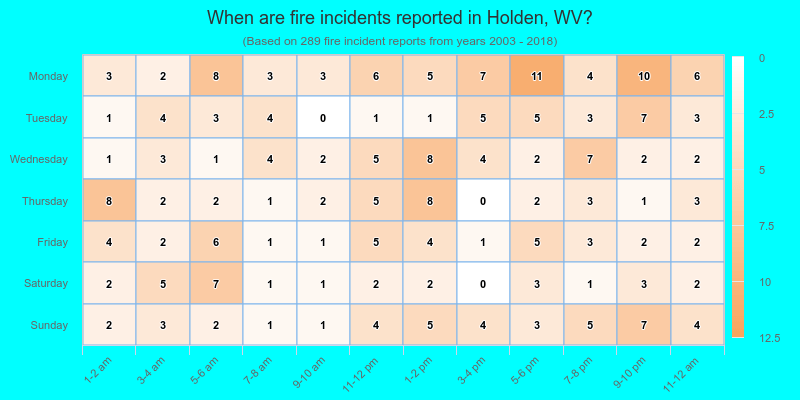
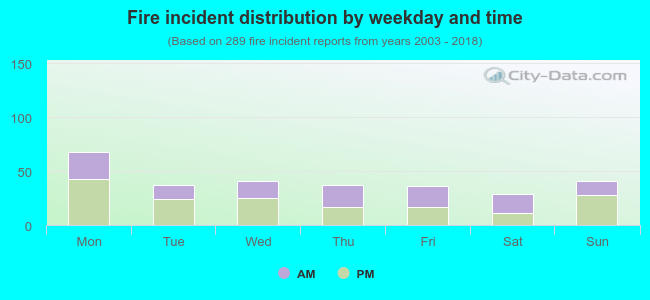 42.9% incidents where reported in the morning and 57.1% in the evening. The most fires (23.5%) took place on Monday, and the least (10.0%) on Saturday.
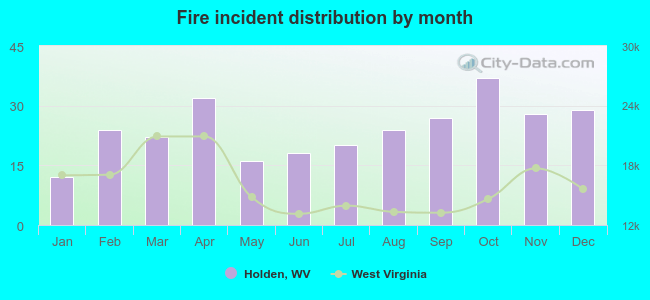 Based on the 289 fire incidents from years 2003 - 2018 most fires (12.8%) took place during October, and the least (4.2%) in January.
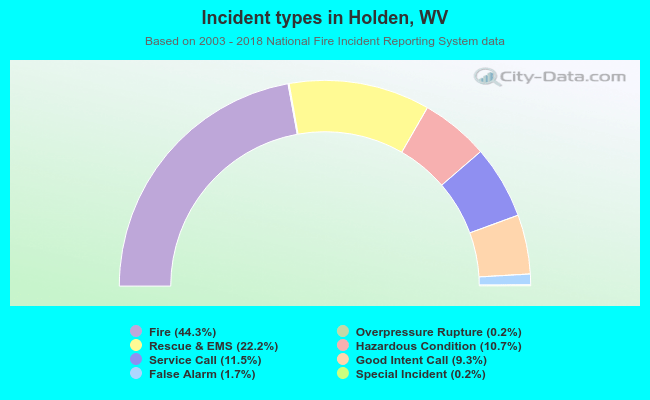 Out of all 653 cases reported during the years 2003 - 2018, the most belonged to the categories: Fire (44.3%), Rescue & EMS (22.2%), and Service Call (11.5%).
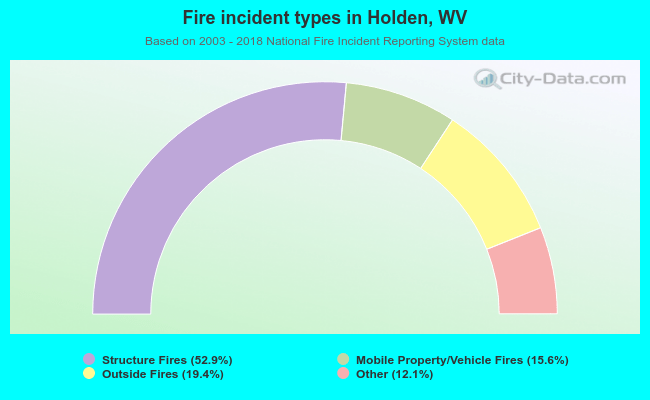 When looking into fire subcategories, the most reports belonged to: Structure Fires (52.9%), and Outside Fires (19.4%).