| Fire incidents reported |
|---|
| Sreet name | Count |
|---|
| 18 CHEROKEE PLACE | 4 | | 2 PARK DRIVE | 4 | | 7 INDIAN WELLS | 4 | | BEAVER DRIVE | 4 | | COUNTRY CLUB | 4 | | HOLIDAY ISLAND DR | 4 | | SUMMIT | 4 | | TABLE ROCK | 4 | | TWIN PEAK | 4 | | # 1 FOREST PARK DR. | 2 | | # 5 PARK DR. | 2 | | 1 B FAIRWAY | 2 | | 1 BLUE HERON | 2 | | 1 BLUE WATER LANE | 2 | | 1 FAIRWAY PLACE | 2 | | 1 FOREST PARK DRIVE | 2 | | 1 LANDING DR | 2 | | 1 LANDING DRIVE | 2 | | 1 MERCURY LANE | 2 | | 10 BANDY DRIVE | 2 | | 10 GREEN MEADOW LANE APT. A | 2 | | 10 W. BLUFF LANE | 2 | | 101 SATURN | 2 | | 108 TABLE ROCK DRIVE | 2 | | 11 HILLCREST | 2 |
| | | Fire incidents reported |
|---|
| Sreet name | Count |
|---|
| 115 SHIELDS DRIVE | 2 | | 119 APPALOOSA DRIVE | 2 | | 122 STATELINE | 2 | | 124 WOODSDALE | 2 | | 125 HOLIDAY ISLAND DR | 2 | | 13 BEAVER DRIVE | 2 | | 13 GREEN MEADOW | 2 | | 13 SYCAMORE | 2 | | 13 SYCAMORE LN | 2 | | 14 APPALOOSA | 2 | | 14 VENUS AVENUE | 2 | | 15 B LAKEVIEW | 2 | | 155 TABLE ROCK DR | 2 | | 166 HOLIDAY ISLAND DRIVE | 2 | | 17 12 ELK STREET | 2 | | 175 STATELINE | 2 | | 19 LAKESIDE | 2 | | 19 STARLITE | 2 | | 19 VALLEY DR | 2 | | 19 WHITE RIVER LANE | 2 | | 2 COUNTRY CLUB DRIVE | 2 | | 2 PARKWOOD DR. | 2 | | 20 QUAIL RUN DR | 2 | | 210 STATELINE | 2 | | |
|
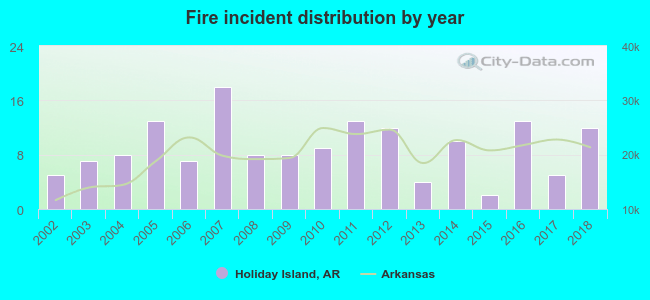 According to the data from the years 2002 - 2018 the average number of fires per year is 9. The highest number of fire incidents - 18 took place in 2007, and the least - 2 in 2015. The data has a rising trend.
 29.9% incidents where reported in the morning and 70.1% in the evening. The most fires (19.5%) took place on Monday, and the least (10.4%) on Thursday.
 Based on the 154 fire incident reports from years 2002 - 2018 most fires (21.4%) took place during January, and the least (3.9%) in October.
 Out of all 2,170 cases reported during the years 2002 - 2018, the most belonged to the categories: Rescue & EMS (60.2%), Service Call (22.5%), and Fire (7.1%).
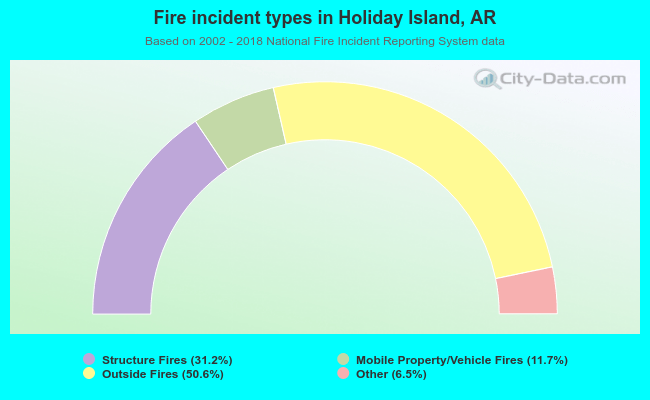 When looking into fire subcategories, the most reports belonged to: Outside Fires (50.6%), and Structure Fires (31.2%).