Holley: Fire Incidents, New York (NY)
Where are fire incidents reported in Holley, NY
Something went wrong! Please refresh the page.
|
| |||||||||||||||||||||||||||||||||||||||||||||||||||||||||||||||||||||||||||||||||||||||||||||||||||||||||||||
2002 - 2018 National Fire Incident Reporting System (NFIRS) incidents
- Incident types reported to NFIRS in Holley, NY
- 69835.0%Rescue & EMS
- 37818.9%Hazardous Condition
- 31015.5%Good Intent Call
- 28914.5%Fire
- 22811.4%Service Call
- 773.9%False Alarm
- 120.6%Severe Weather
- 30.2%Overpressure Rupture
- Fire incident types reported to NFIRS in Holley, NY
- 15252.6%Structure Fires
- 9031.1%Outside Fires
- 279.3%Mobile Property/Vehicle Fires
- 206.9%Other
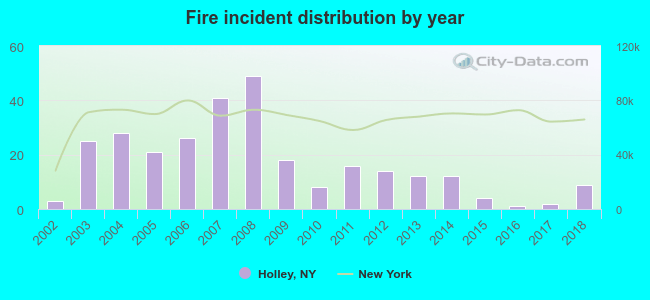 According to the data from the years 2002 - 2018 the average number of fires per year is 17. The highest number of reported fires - 49 took place in 2008, and the least - 1 in 2016. The data has an increasing trend.
 24.9% incidents where reported in the morning and 75.1% in the evening. The most fires (17.3%) took place on Saturday, and the least (8.7%) on Thursday.
 According to the 289 fire incidents from years 2002 - 2018 most fires (13.1%) took place during April, and the least (5.2%) in September.
 Out of all 1,995 cases reported during the years 2002 - 2018, the most belonged to the categories: Rescue & EMS (35.0%), Hazardous Condition (18.9%), and Good Intent Call (15.5%).
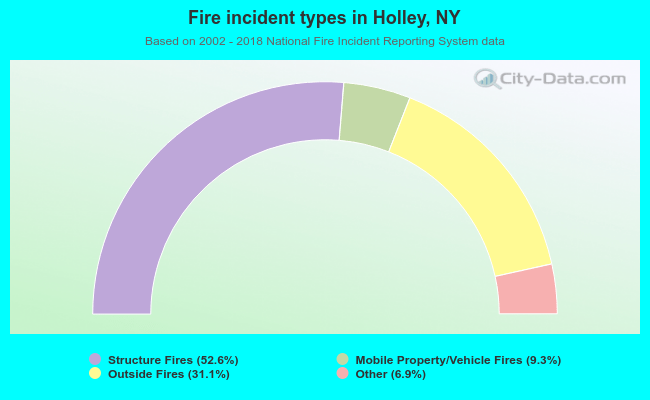 When looking into fire subcategories, the most reports belonged to: Structure Fires (52.6%), and Outside Fires (31.1%).