Holliday: Fire Incidents, Texas (TX)
Where are fire incidents reported in Holliday, TX
Something went wrong! Please refresh the page.
|
| |||||||||||||||||||||||||||||||||||||||||||||||||||||||||||||||||||||||||||||||||||||||||||||||||||||||||||||
2002 - 2018 National Fire Incident Reporting System (NFIRS) incidents
- Incident types reported to NFIRS in Holliday, TX
- 40461.7%Fire
- 19329.5%Rescue & EMS
- 365.5%Good Intent Call
- 172.6%Hazardous Condition
- 30.5%False Alarm
- 20.3%Service Call
- Fire incident types reported to NFIRS in Holliday, TX
- 29974.0%Outside Fires
- 6917.1%Structure Fires
- 194.7%Other
- 174.2%Mobile Property/Vehicle Fires
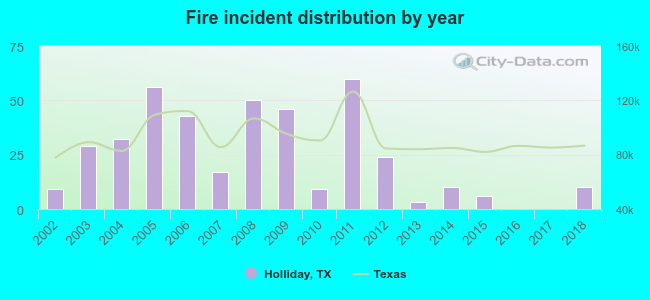 Based on the data from the years 2002 - 2018 the average number of fire incidents per year is 24. The highest number of reported fire incidents - 60 took place in 2011, and the least - 0 in 2016. The data has a rising trend.
 26.5% incidents where reported in the morning and 73.5% in the evening. The most fires (16.1%) took place on Monday, and the least (11.9%) on Saturday.
 Based on the 404 fires from years 2002 - 2018 most fires (16.3%) took place during July, and the least (3.2%) in November.
 Out of all 655 cases reported during the years 2002 - 2018, the most belonged to the categories: Fire (61.7%), Overpressure Rupture (29.5%), and Service Call (5.5%).
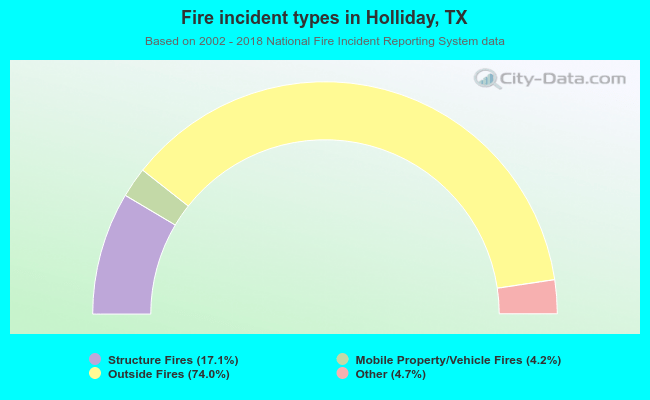 When looking into fire subcategories, the most incidents belonged to: Outside Fires (74.0%), and Structure Fires (17.1%).