Hollidaysburg: Fire Incidents, Pennsylvania (PA)
Where are fire incidents reported in Hollidaysburg, PA
Something went wrong! Please refresh the page.
|
| |||||||||||||||||||||||||||||||||||||||||||||||||||||||||||||||||||||||||||||||||||||||||||||||||||||||||||||
2004 - 2018 National Fire Incident Reporting System (NFIRS) incidents
- Incident types reported to NFIRS in Hollidaysburg, PA
- 37737.1%Rescue & EMS
- 15014.8%Service Call
- 12812.6%Fire
- 12712.5%Good Intent Call
- 10810.6%Hazardous Condition
- 1009.9%False Alarm
- 131.3%Special Incident
- 101.0%Severe Weather
- 20.2%Overpressure Rupture
- Fire incident types reported to NFIRS in Hollidaysburg, PA
- 7659.4%Structure Fires
- 2015.6%Outside Fires
- 2015.6%Other
- 129.4%Mobile Property/Vehicle Fires
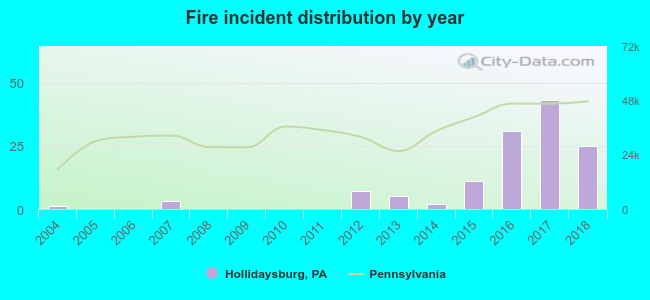 Based on the data from the years 2004 - 2018 the average number of fires per year is 9. The highest number of fires - 43 took place in 2017, and the least - 0 in 2005. The data has an increasing trend.
The average number of yearly fire incidents per 10k residents in Hollidaysburg, PA compared to nearest cities:
(Note: Based on data for the last 3 years, including only cities with population 5,000 and above)
| Hollidaysburg: | 57.1 |
| Altoona: | 16.9 |
| Tyrone: | 77.4 |
| Huntingdon: | 28.9 |

 41.4% incidents where reported in the morning and 58.6% in the evening. The most fires (22.7%) took place on Wednesday, and the least (6.3%) on Friday.
 Based on the 128 incident reports from years 2004 - 2018 most fires (18.8%) took place during March, and the least (1.6%) in December.
 Out of all 1,015 cases reported during the years 2004 - 2018, the most belonged to the categories: Rescue & EMS (37.1%), Service Call (14.8%), and Fire (12.6%).
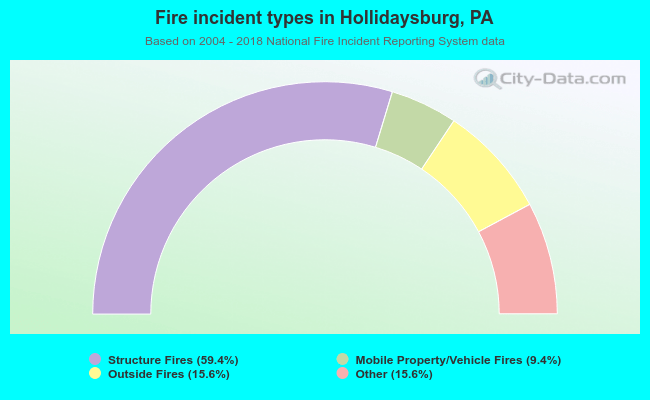 When looking into fire subcategories, the most reports belonged to: Structure Fires (59.4%), and Outside Fires (15.6%).