| Fire incidents reported |
|---|
| Sreet name | Count |
|---|
| HIGHWAY 114 | 12 | | BROAD ST | 6 | | EPHESUS CHURCH ROAD | 6 | | NEW HOPE ROAD | 6 | | ODE RICE ROAD | 6 | | SEMINARY ST | 6 | | 15 MAIN ST | 4 | | 335 MARLBORO ROAD | 4 | | 3577 NORTH ST | 4 | | 365 COLE CIRCLE | 4 | | 455 KEE STREET | 4 | | BARREN SPRINGS CHURCH ROAD | 4 | | BARREN SPRINGS ROAD | 4 | | BROAD STREET | 4 | | CEMETARY BOUNDARY RD | 4 | | DEVAULT LANE | 4 | | HIGHWAY 77 | 4 | | KEE STREET | 4 | | MAIN STREET | 4 | | MCMACKINS LANE | 4 | | MCMACKINS LN | 4 | | SEMINARY STREET | 4 | | 22851 HWY 77 | 2 | | 1140 BUTLER SCHOOL RD | 2 | | 1300 BARRON SPRINGS ROAD | 2 |
| | | Fire incidents reported |
|---|
| Sreet name | Count |
|---|
| 155 DODD STREET SOUTH | 2 | | 1870 MARLBORO RD. | 2 | | 19651 HWY 114 | 2 | | 19735 114 | 2 | | 19735 HIGHWAY 114 | 2 | | 19735 HWY 114 | 2 | | 20515 HWY 114 S. | 2 | | 2065 EPHESUS CHURCH ROAD | 2 | | 21435 SMINARY ST | 2 | | 21625 SEMINARY STREET | 2 | | 23845 HWY 114 N | 2 | | 24310 114 NORTH | 2 | | 255 KEE ST. | 2 | | 25590 HIGHWAY 77 | 2 | | 25995 HWY 70 | 2 | | 2765 EPHESUS CHURCH ROAD | 2 | | 27839 HIGHWAY 114 NORTH | 2 | | 27995 BROAD STREET | 2 | | 280 KEE ST | 2 | | 28245 BROAD STREET | 2 | | 28260 BROAD ST | 2 | | 28505 BROAD STREET | 2 | | 28985 BROAD STREET | 2 | | 29120 BROAD ST | 2 | | 3192 NORTH STREET | 2 |
|
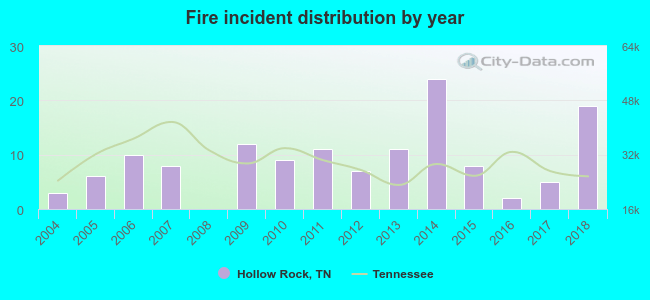 Based on the data from the years 2004 - 2018 the average number of fires per year is 9. The highest number of reported fires - 24 took place in 2014, and the least - 0 in 2008. The data has a rising trend.
 32.6% incidents where reported in the morning and 67.4% in the evening. The most fires (20.0%) took place on Friday, and the least (9.6%) on Sunday.
 According to the 135 fire incident reports from years 2004 - 2018 most fires (14.1%) took place during April, and the least (3.7%) in November.
 Out of all 205 cases reported during the years 2004 - 2018, the most belonged to the categories: Fire (65.9%), Overpressure Rupture (22.9%), and Rescue & EMS (6.3%).
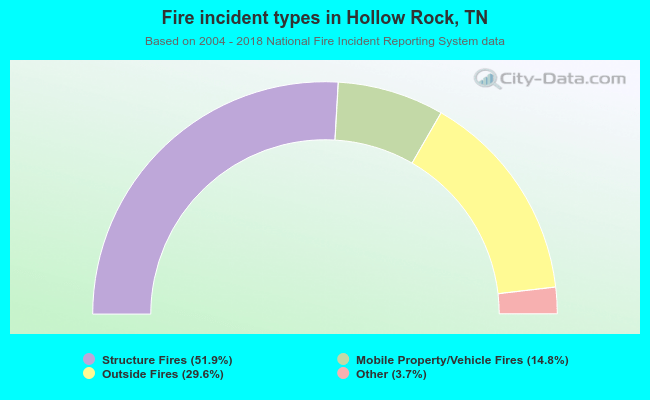 When looking into fire subcategories, the most incidents belonged to: Structure Fires (51.9%), and Outside Fires (29.6%).