| Fire incidents reported |
|---|
| Sreet name | Count |
|---|
| MAIN ST | 16 | | RAILROAD PROPERTY | 10 | | REDDINGTON HILL ROAD | 10 | | CHESTER STREET | 8 | | MAIN STREET | 8 | | REDDINGTON HILL RD | 8 | | US HAUL ROAD | 6 | | 331 HALLAWAY | 4 | | ASHTON ST | 4 | | BELMONT RIDGE RD | 4 | | CLARK ST | 4 | | FLUSHING-HOLLOWAY ROAD RD | 4 | | JEWELL AVE | 4 | | JOCKEY HOLLOW RD | 4 | | PIEDMONTHOLLOWAY ROAD | 4 | | REDDINGTON RD | 4 | | SOUTH STREET ST | 4 | | STATE ROUTE 331 | 4 | | 100 WEST MAIN ST | 2 | | 101 REDDINGTON HOLLOWAY RD | 2 | | 101 REDDINGTON HILL RD | 2 | | 107 W MAIN STREET | 2 | | 112 SOUTH SECOND ST ST | 2 | | 123 CHESTER ST | 2 | | 210 SOUTH ST | 2 |
| | | Fire incidents reported |
|---|
| Sreet name | Count |
|---|
| 210 SOUTH ST ST | 2 | | 2ND ST | 2 | | 300 E MAIN STREET | 2 | | 301 E. MAIN STREET | 2 | | 73200 RESERVOIR RD RD | 2 | | 73200 RESERVOIR HILL ROAD | 2 | | ASHTON STREET | 2 | | ASHTON STREET ST | 2 | | CENTER STREET ST | 2 | | CIREDDU ST | 2 | | CLARK STREET | 2 | | CLARK STREET ST | 2 | | EAST MAIN STREET | 2 | | FIRST ST | 2 | | FLUSHING HOLLOWAY RD | 2 | | FLUSHING HOLLOWAY RD | 2 | | FLUSHING-HOLLOWAY RD | 2 | | FLUSHING-HOLLOWAY RD. | 2 | | FLUSHINGHOLLOWAY ROAD RD | 2 | | HICKORY HILL RD | 2 | | HILLSIDE LN | 2 | | HOLLOWAY FLUSHING RD | 2 | | HOLLOWAYPIEDMONT RD | 2 | | JEWEL AVE | 2 | | |
|
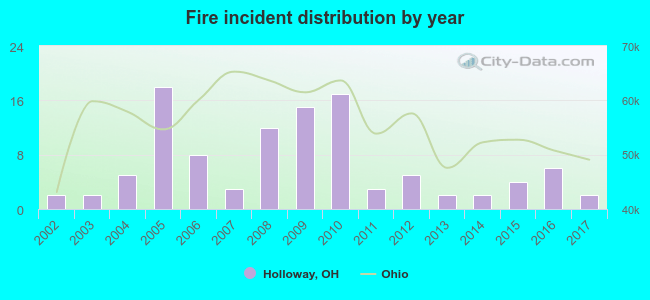 Based on the data from the years 2002 - 2017 the average number of fires per year is 7. The highest number of fire incidents - 18 took place in 2005, and the least - 2 in 2002. The data has a constant trend.
 32.1% incidents where reported in the morning and 67.9% in the evening. The most fires (17.9%) took place on Monday, and the least (7.5%) on Wednesday.
 According to the 106 incident reports from years 2002 - 2017 most fires (13.2%) took place during October, and the least (2.8%) in June.
 Out of all 148 cases reported during the years 2002 - 2017, the most belonged to the categories: Fire (71.6%), Overpressure Rupture (14.9%), and Rescue & EMS (10.1%).
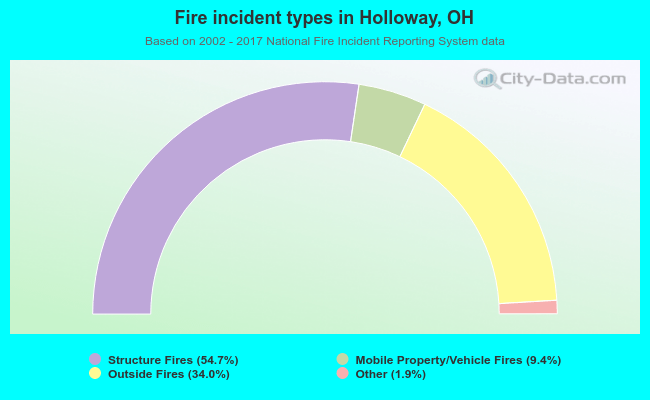 When looking into fire subcategories, the most incidents belonged to: Structure Fires (54.7%), and Outside Fires (34.0%).