Homeland Park: Fire Incidents, South Carolina (SC)
Where are fire incidents reported in Homeland Park, SC
Something went wrong! Please refresh the page.
|
| |||||||||||||||||||||||||||||||||||||||||||||||||||||||||||||||||||||||||||||||||||||||||||||||||||||||||||||
2010 - 2018 National Fire Incident Reporting System (NFIRS) incidents
- Incident types reported to NFIRS in Homeland Park, SC
- 38626.7%Rescue & EMS
- 38426.6%Fire
- 26218.1%Good Intent Call
- 16211.2%False Alarm
- 1298.9%Hazardous Condition
- 1178.1%Service Call
- 30.2%Severe Weather
- Fire incident types reported to NFIRS in Homeland Park, SC
- 18849.0%Structure Fires
- 12332.0%Outside Fires
- 6717.4%Mobile Property/Vehicle Fires
- 61.6%Other
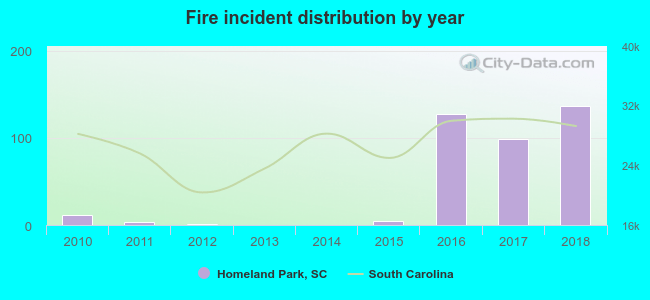 According to the data from the years 2010 - 2018 the average number of fire incidents per year is 43. The highest number of fires - 137 took place in 2018, and the least - 0 in 2013. The data has a rising trend.
The average number of yearly fire incidents per 10k residents in Homeland Park, SC compared to nearest cities:
(Note: Based on data for the last 3 years, including only cities with population 5,000 and above)
| Homeland Park: | 192.2 |
| Anderson: | 254.5 |
| Centerville: | 15.2 |
| Clemson: | 40.7 |
| Central: | 54.4 |
| Piedmont: | 313.5 |
| Oakway: | 21.1 |
| Seneca: | 131.4 |
| Powderville: | 49.0 |
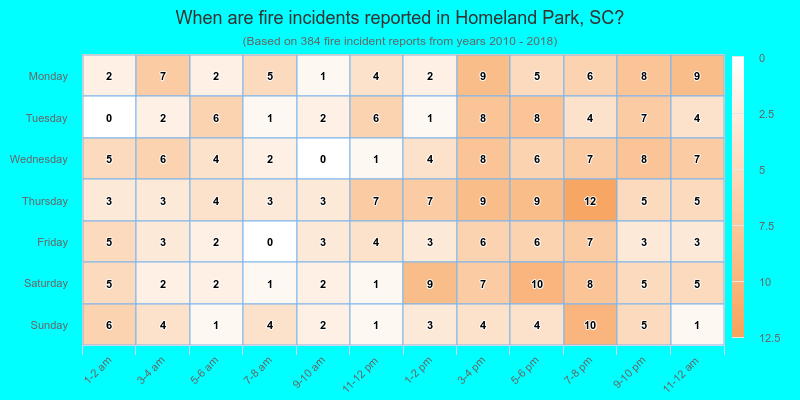
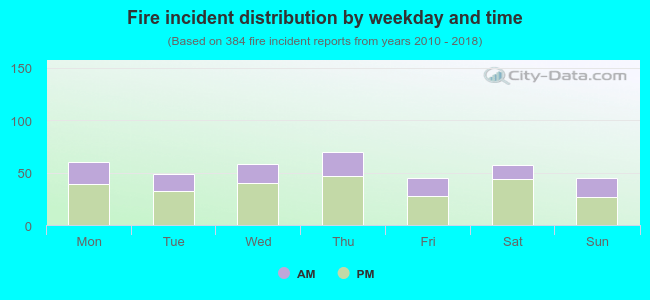 33.1% incidents where reported in the morning and 66.9% in the evening. The most fires (18.2%) took place on Thursday, and the least (11.7%) on Friday.
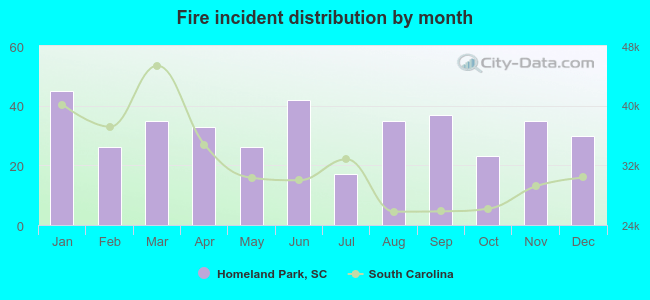 Based on the 384 reports from years 2010 - 2018 most fires (11.7%) took place during January, and the least (4.4%) in July.
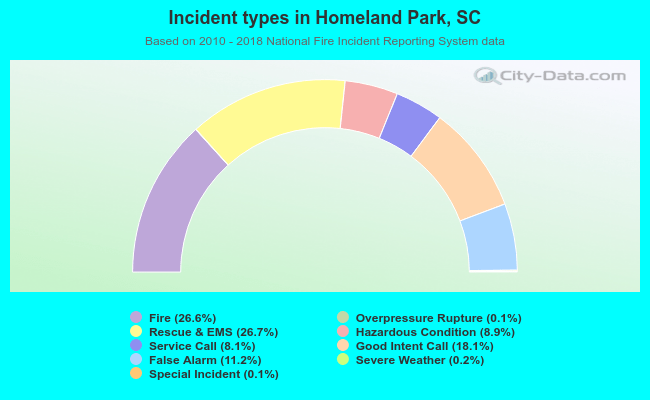 Out of all 1,445 cases reported during the years 2010 - 2018, the most belonged to the categories: Rescue & EMS (26.7%), Fire (26.6%), and Good Intent Call (18.1%).
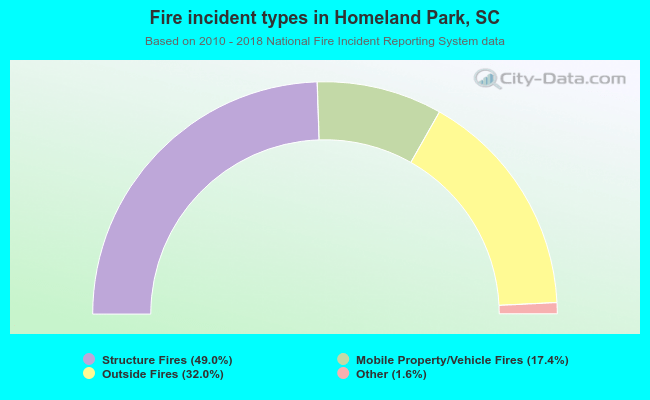 When looking into fire subcategories, the most incidents belonged to: Structure Fires (49.0%), and Outside Fires (32.0%).