| Fire incidents reported |
|---|
| Sreet name | Count |
|---|
| HAWAII BELT RD | 42 | | LEHUA ST | 42 | | HONOKAA-WAIPIO RD | 36 | | OLD MAMALAHOA HWY | 28 | | PAKALANA ST | 28 | | KAHANA DR | 20 | | KUKUIHAELE RD | 20 | | HONOKAAWAIPIO RD | 18 | | HWY 19 | 16 | | KALOPA RD | 16 | | WAIPIO VALLEY RD | 16 | | MAMANE ST | 14 | | HAINA CAMP RD | 10 | | KALOPA MAUKA RD | 10 | | MAILE ST | 10 | | NAUPAKA ST | 10 | | KALEHUA RD | 8 | | KAPUNA RD | 8 | | OHIA ST | 8 | | PAAUHAU ST | 8 | | ANA PUU PL | 6 | | CANE HAUL RD | 6 | | HOO KAHUA RD | 6 | | HUAPALA ST | 6 | | KAAO RD | 6 |
| | | Fire incidents reported |
|---|
| Sreet name | Count |
|---|
| KIA MANU RD | 6 | | KONIAKA PL | 6 | | PAAUILO MAUKA RD | 6 | | PIKAKE ST | 6 | | HWY 19 HWY | 4 | | ILIMA ST | 4 | | KAHILI ST | 4 | | KALOPA LOWER RD | 4 | | KAPULENA AIR STRIP RD | 4 | | KOA ST | 4 | | LOKELANI ST | 4 | | OLD GOVERNMENT RD | 4 | | POHAKEA MAUKA RD | 4 | | POHAKEA RD | 4 | | SPENCER RD | 4 | | STANDARD OIL RD | 4 | | 19 HWY | 2 | | AKIA ST | 2 | | ALANUI O HONOKAIA RD | 2 | | HAINA CAMP BALLPARK | 2 | | HALA ST | 2 | | HAMAKUA ENERGY PLANT | 2 | | HIGHWAY 19 HWY | 2 | | HONOKAA TRANSFER STATION | 2 | | |
|
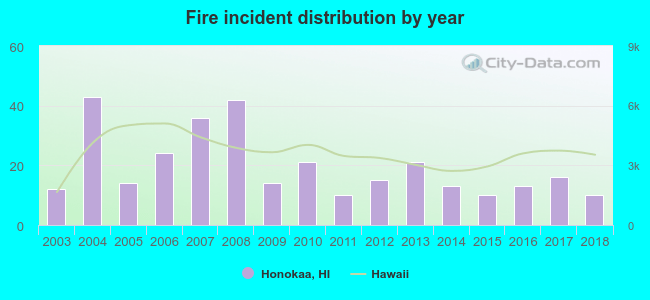 According to the data from the years 2003 - 2018 the average number of fires per year is 20. The highest number of reported fires - 43 took place in 2004, and the least - 10 in 2011. The data has a dropping trend.
 34.4% incidents where reported in the morning and 65.6% in the evening. The most fires (16.6%) took place on Sunday, and the least (10.8%) on Thursday.
 Based on the 314 fire incident reports from years 2003 - 2018 most fires (12.7%) took place during June, and the least (4.8%) in April.
 Out of all 2,595 cases reported during the years 2003 - 2018, the most belonged to the categories: Overpressure Rupture (63.7%), Fire (12.1%), and Service Call (8.7%).
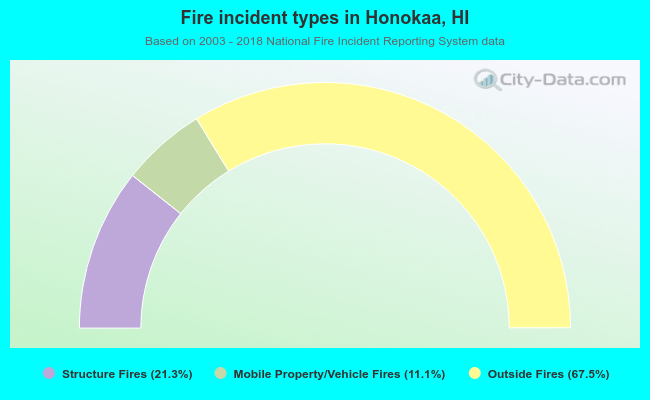 When looking into fire subcategories, the most incidents belonged to: Outside Fires (67.5%), and Structure Fires (21.3%).