| Fire incidents reported |
|---|
| Sreet name | Count |
|---|
| NATIONAL PIKE | 8 | | NATIONAL PIKE | 8 | | SUMMIT ( N. UNION ) MTN | 8 | | ATLAS XING | 6 | | CRAIG LA | 6 | | NATIONAL PIKE ( S.UNION ) PIKE | 6 | | REDSTONE FURNACE RD | 6 | | SHAFFERS CORNER RD | 6 | | SHELLIE ST | 6 | | SKYLINE DR | 6 | | ATLAS RD | 4 | | CHAFFEE ST | 4 | | CHALK HILL RD | 4 | | COOLSPRING JUMONVILLE RD | 4 | | ELM RD | 4 | | HOPWOOD COOLSPRING RD | 4 | | JUMONVILLE RD | 4 | | LOCUST ST | 4 | | MADISON AVE | 4 | | MOUNTAIN VIEW RD | 4 | | OLD FURNACE RD | 4 | | PINE RIDGE RD | 4 | | REPPERT BLVD | 4 | | SR40 RD | 4 | | SUMMIT ( S. UNION ) MTN | 4 |
| | | Fire incidents reported |
|---|
| Sreet name | Count |
|---|
| WHARTON FURNACE RD | 4 | | 1000 NATIONAL PIKE | 2 | | 101 SKYLINE DR | 2 | | 188 HOPWOOD COOLSPRING RD | 2 | | 1ST ST { LEMONT FURNACE } ST | 2 | | ADELE AVE | 2 | | ASH RD | 2 | | BARTON HOLW | 2 | | BEECH STREET | 2 | | BITNER | 2 | | BOOKER WAY | 2 | | BRADBURY ST | 2 | | BRADDOCK ST | 2 | | BROWNFIELD LA | 2 | | BROWNFIELD RD | 2 | | BRYSON BLVD | 2 | | BUDDY LANE | 2 | | BUDDYS LA | 2 | | CENTER AVE | 2 | | CHAFFEE ST | 2 | | CHERRY LA | 2 | | CHURCH ST | 2 | | CONNELLSVILLE ST | 2 | | COOLSPRING ST | 2 | | |
|
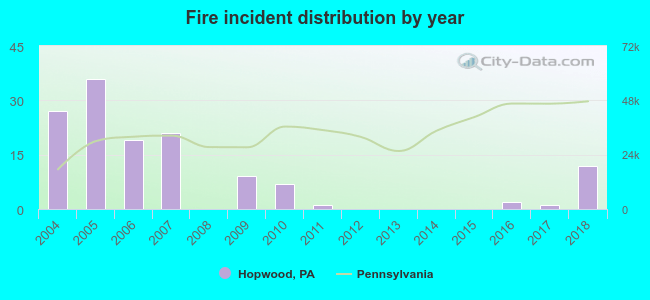 According to the data from the years 2004 - 2018 the average number of fire incidents per year is 9. The highest number of reported fire incidents - 36 took place in 2005, and the least - 0 in 2008. The data has a decreasing trend.
 35.6% incidents where reported in the morning and 64.4% in the evening. The most fires (29.6%) took place on Saturday, and the least (7.4%) on Monday.
 According to the 135 fires from years 2004 - 2018 most fires (18.5%) took place during April, and the least (2.2%) in September.
 Out of all 256 cases reported during the years 2004 - 2018, the most belonged to the categories: Fire (52.7%), Rescue & EMS (24.6%), and Overpressure Rupture (13.3%).
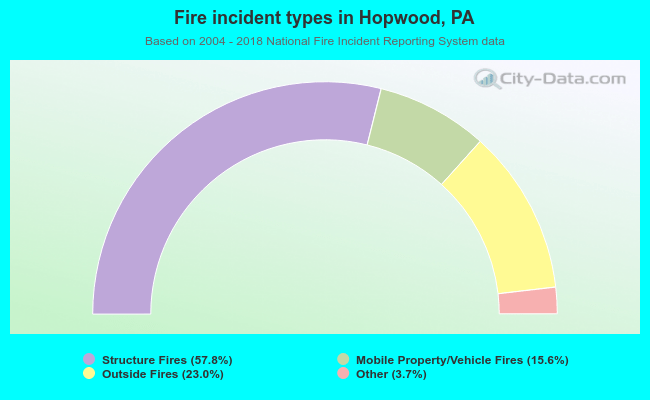 When looking into fire subcategories, the most reports belonged to: Structure Fires (57.8%), and Outside Fires (23.0%).