| Fire incidents reported |
|---|
| Sreet name | Count |
|---|
| HWY 71 | 22 | | ASH CREEK RD | 8 | | 6TH STREET | 4 | | CASCADE RD | 4 | | RED CANYON RD. | 4 | | SHEPS CANYON RD | 4 | | UNIVERSITY AVE | 4 | | 1 MILE S OF PARKER PEAK | 2 | | 1.2 MILES OFF OF E. SOUTH SHOR | 2 | | 1001 S 6TH ST | 2 | | 1002 SUMMERVILLE ST | 2 | | 1045 JENSEN AVE | 2 | | 108 S. 23RD | 2 | | 112 SO CHICAGO ST | 2 | | 1140 S. 6TH STREET | 2 | | 1145 SHERMAN | 2 | | 1145 SHERMAN ST | 2 | | 11684 INDIAN CANYON ROAD | 2 | | 1200 TRL ESTATES | 2 | | 12163 HIGHLAND RD | 2 | | 12526 PINE SHADOWS RD | 2 | | 12658 COUNTRY CLUB ESTATES | 2 | | 12676 HOT BROOK CANYON | 2 | | 12700 RIDGEVIEW DR. | 2 | | 12724 RIDGEVIEWCOUNTRY CLUB | 2 |
| | | Fire incidents reported |
|---|
| Sreet name | Count |
|---|
| 12750 MERCHEN RD #25 | 2 | | 12775 E. CASCADE MT. RD. | 2 | | 12795 HOT BROOK CANYON RD | 2 | | 12908 BADGER CLARK RD | 2 | | 13157 ANGOSTURA RD | 2 | | 13203 FALL RIVER RD | 2 | | 13245 FALL RIVER RD | 2 | | 1339 DEXTER | 2 | | 1343 SHERMAN ST | 2 | | 13454 E. SOUTH SHORE RD | 2 | | 1346 GALVISTON AVE | 2 | | 138 S 24TH | 2 | | 1402 MARTAN ST. | 2 | | 143 S. CHICAGO ST. | 2 | | 1510 NATIONAL AVE | 2 | | 1545 SCHOOL ST | 2 | | 1609 UNIVERSITY AVE | 2 | | 16TH CANTON ST | 2 | | 1735 UNIVERSITY AVE | 2 | | 1741 UNIVERSITY AVE | 2 | | 1742 ALBANY | 2 | | 1800 HWY18 BYPASS | 2 | | 1820 SUMMIT RD | 2 | | 18200 FALL RIVER ROAD | 2 | | |
|
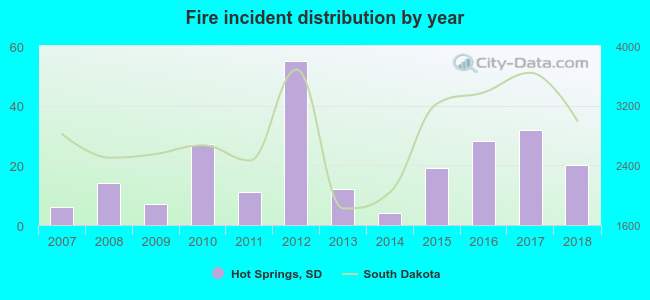 According to the data from the years 2007 - 2018 the average number of fires per year is 20. The highest number of fire incidents - 55 took place in 2012, and the least - 4 in 2014. The data has a rising trend.
 28.5% incidents where reported in the morning and 71.5% in the evening. The most fires (16.6%) took place on Monday, and the least (9.8%) on Wednesday.
 Based on the 235 fire incidents from years 2007 - 2018 most fires (28.9%) took place during July, and the least (3.4%) in February.
 Out of all 455 cases reported during the years 2007 - 2018, the most belonged to the categories: Fire (51.6%), Rescue & EMS (14.9%), and Hazardous Condition (13.4%).
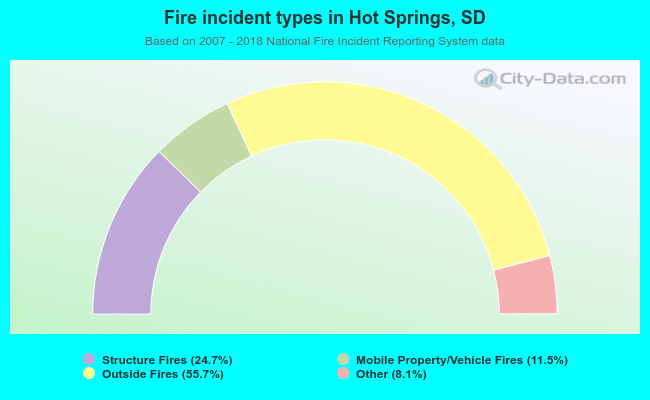 When looking into fire subcategories, the most incidents belonged to: Outside Fires (55.7%), and Structure Fires (24.7%).