| Fire incidents reported |
|---|
| Sreet name | Count |
|---|
| SMITH BRIDGE RD | 16 | | HOT SPRINGS RD | 12 | | JACKSON RIVER RD | 12 | | FALLS RD | 10 | | MAIN ST | 8 | | TREETOP DR | 6 | | 5434 JACKSON RIVER TPK. | 4 | | 106 CHIMMNEY RUN ROAD | 2 | | 112 TINKERTOWN RD | 2 | | 116 SAND HILL RD. | 2 | | 1175 VIRGINIA AVE | 2 | | 1266 SHADY LANE | 2 | | 127 TRIPLE OAK LANE | 2 | | 144 WHITE OAK LANE | 2 | | 155 MILL RACE LN. | 2 | | 16351 SAM SNEAD HWY. | 2 | | 1696 JACKSON RIVER TPK. | 2 | | 171 BURGER LANE | 2 | | 1766 HOMESTEAD DRIVE | 2 | | 2116 JACKSON RIVER TURNPIKE | 2 | | 2220 SAM SNEAD HWY | 2 | | 234 FORESTRY ROAD | 2 | | 254 REDEMPTION RD. | 2 | | 267 THOMASTOWN RD | 2 | | 2793 MAIN STREET | 2 |
| | | Fire incidents reported |
|---|
| Sreet name | Count |
|---|
| 281 BROOK DR | 2 | | 324 THOMASTOWN RD. | 2 | | 411 AIRPORT ROAD | 2 | | 527 MAIN ST. | 2 | | 527 MAIN STREET | 2 | | 545 MAIN STREET | 2 | | 81 BILLY GOAT LANE | 2 | | 85 COURT HOUSE HILL RD. | 2 | | 8629 MCGRAW GAP ROAD | 2 | | 8883 SAM SNEAD HWY | 2 | | 9918 MCGRAW GAP ROAD | 2 | | ASHWOOD DR | 2 | | BATH COUNTY | 2 | | BROOK DR | 2 | | COLES MTN RD | 2 | | CREEKSIDE DRIVE | 2 | | HOT SPRINGS RD | 2 | | HOT SPRINGS RD RD | 2 | | JACKSON RIVER | 2 | | JACKSON RIVER ROAD | 2 | | JACKSON RIVER TPKE | 2 | | LITTLE MOUNTAIN RD | 2 | | LITTLE MOUNTAIN ROAD | 2 | | LOWER CASCADES | 2 | | |
|
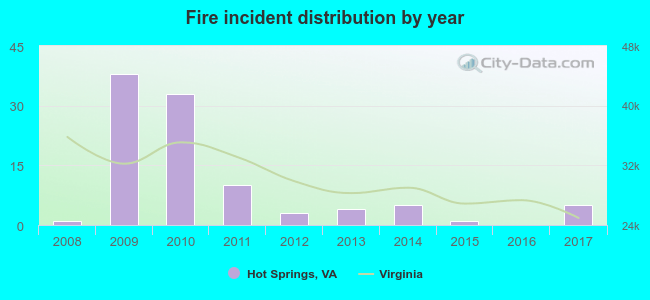 According to the data from the years 2008 - 2017 the average number of fire incidents per year is 10. The highest number of fires - 38 took place in 2009, and the least - 0 in 2016. The data has a growing trend.
 33.0% incidents where reported in the morning and 67.0% in the evening. The most fires (19.0%) took place on Monday, and the least (7.0%) on Wednesday.
 Based on the 100 fires from years 2008 - 2017 most fires (17.0%) took place during November, and the least (2.0%) in October.
 Out of all 135 cases reported during the years 2008 - 2017, the most belonged to the categories: Fire (74.1%), Overpressure Rupture (11.9%), and Rescue & EMS (5.9%).
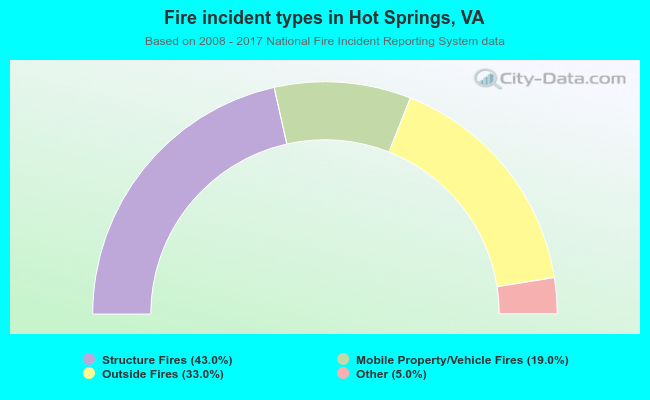 When looking into fire subcategories, the most reports belonged to: Structure Fires (43.0%), and Outside Fires (33.0%).