| Fire incidents reported |
|---|
| Sreet name | Count |
|---|
| COUNTY 26 | 10 | | YUCATAN RD | 8 | | CARLSON RD | 6 | | SANDEN RD | 6 | | STATE 16 | 6 | | STINSON RIDGE RD | 6 | | STORER VALLEY RD. | 6 | | COUNTY 9 | 4 | | COUNTY ROAD 26 | 4 | | GRANT ST | 4 | | GRANT ST. | 4 | | MOUND PRAIRIE DR. | 4 | | PLUM ST. | 4 | | SHERIDAN ST. | 4 | | ST. HWY. 76 | 4 | | STATE HWY. 16 | 4 | | SWEDE BOTTOM RD | 4 | | 101 S GRANT | 2 | | 103 E CEDAR ST | 2 | | 105 W ELM | 2 | | 10619 YUCATAN RD | 2 | | 117 S JACKSON ST | 2 | | 13686 STATE 16 | 2 | | 13686 STATE 76 | 2 | | 13839 ADDLERMER DR | 2 |
| | | Fire incidents reported |
|---|
| Sreet name | Count |
|---|
| 14100 TORGERSON DR | 2 | | 14212 PARADISE DRIVE | 2 | | 1524 CLINTON RD | 2 | | 16282 CONNERY DRIVE | 2 | | 1693 SOUTH RIDGE ROAD | 2 | | 18254 FRANKLIN DR | 2 | | 1837 VINEGAR HILL LANE | 2 | | 18463 COUNTY 13 | 2 | | 18674 COUNTY 13 | 2 | | 18785 PERKINS VALLEY | 2 | | 200 S ERICKSON ST | 2 | | 209 S. ELLSWORTH ST. | 2 | | 232 COUNTY ROAD 9 | 2 | | 2323 ST HWY 16 | 2 | | 26240 CATEKA COULIE DR | 2 | | 2834 STORER VALLEY RD | 2 | | 300 N GRANT | 2 | | 32406 STINSON RD | 2 | | 32406 STINSON RIDGE RD | 2 | | 33961 COUNTY RD 26 | 2 | | 41568 RIDGEVIEW RD | 2 | | 42434 COUNTY 1 | 2 | | 4386 BUELL RD | 2 | | 5954 SWEDE DOTTOM RD | 2 | | |
|
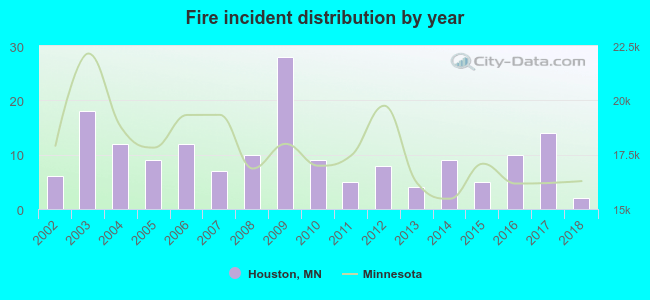 Based on the data from the years 2002 - 2018 the average number of fires per year is 10. The highest number of fires - 28 took place in 2009, and the least - 2 in 2018. The data has a decreasing trend.
 29.8% incidents where reported in the morning and 70.2% in the evening. The most fires (20.8%) took place on Saturday, and the least (9.5%) on Monday.
 Based on the 168 incident reports from years 2002 - 2018 most fires (18.5%) took place during April, and the least (3.6%) in July.
 Out of all 248 cases reported during the years 2002 - 2018, the most belonged to the categories: Fire (67.7%), Rescue & EMS (12.9%), and False Alarm (9.3%).
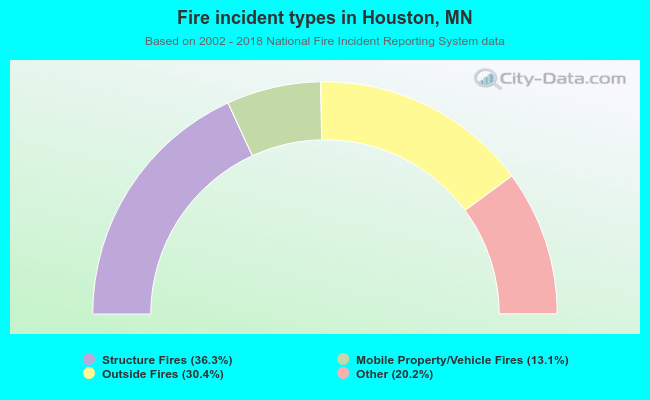 When looking into fire subcategories, the most reports belonged to: Structure Fires (36.3%), and Outside Fires (30.4%).