| Fire incidents reported |
|---|
| Sreet name | Count |
|---|
| MINERAL DRIVE | 16 | | HIGHWAY 17 | 14 | | CHESTNUT ST | 10 | | HWY 63 | 10 | | MORTON ROAD | 10 | | SAM HOUSTON BLVD | 10 | | HIGHWAY 63 | 8 | | MILL ST | 8 | | NORTH HIGHWAY 63 | 8 | | 7400 HIGHWAY 17 | 6 | | BRUSHY CREEK ROAD | 6 | | HIGHWAY B | 6 | | HIGHWAY UU | 6 | | HIGHWAY Z | 6 | | MAIN STREET | 6 | | PRESCOTT RD | 6 | | 10014 PRESCOTT ROAD | 4 | | 16317 CLEVELAND ROAD | 4 | | 17 | 4 | | 17409 OAKWOOD ROAD | 4 | | 17773 BRUSHY CREEK ROAD | 4 | | 5116 HAMILTON CREEK ROAD | 4 | | 515 OAK HILL RD. | 4 | | 6293 HIGHWAY 17 | 4 | | 6580 HWY 137 | 4 |
| | | Fire incidents reported |
|---|
| Sreet name | Count |
|---|
| 7198 HIGHWAY 17 | 4 | | 8164 MORTON ROAD | 4 | | 8175 MINERAL DRIVE | 4 | | 8227 FISHER DRIVE, LOT 4 | 4 | | 8294 FISHER DRIVE | 4 | | 8783 HIGHWAY 63 | 4 | | B | 4 | | BRYAN ST | 4 | | DEWEY ST | 4 | | DEWEY STREET | 4 | | FORREST DR | 4 | | FORREST DRIVE | 4 | | GRAND AVE | 4 | | HAWKEYE ROAD | 4 | | HAWTHORNE ST | 4 | | HIGHWAY 63 SOUTH | 4 | | INDUSTRIAL DR | 4 | | KEENVIEW RD | 4 | | LILLY ROAD | 4 | | MILLSTONE RD | 4 | | OAK HILL ST | 4 | | OAK ST | 4 | | OAKWOOD ROAD | 4 | | OZARK ST | 4 | | PHELPS ST | 4 |
|
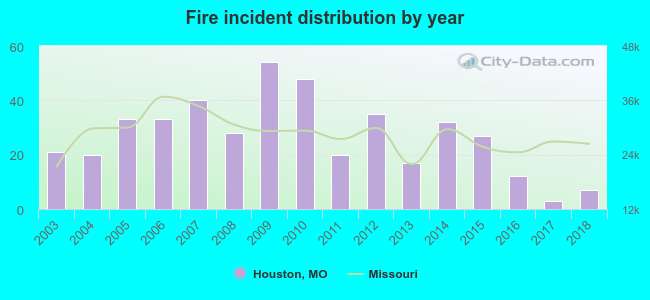 According to the data from the years 2003 - 2018 the average number of fire incidents per year is 27. The highest number of reported fires - 54 took place in 2009, and the least - 3 in 2017. The data has a declining trend.
 29.8% incidents where reported in the morning and 70.2% in the evening. The most fires (15.8%) took place on Monday, and the least (13.0%) on Wednesday.
 According to the 430 reports from years 2003 - 2018 most fires (18.8%) took place during March, and the least (3.0%) in June.
 Out of all 581 cases reported during the years 2003 - 2018, the most belonged to the categories: Fire (74.0%), Rescue & EMS (9.3%), and Service Call (8.4%).
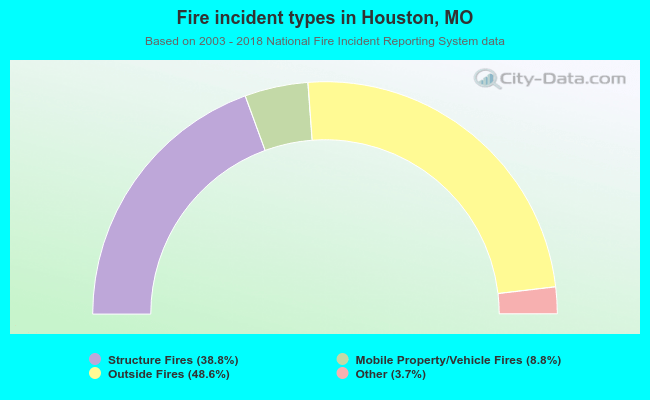 When looking into fire subcategories, the most reports belonged to: Outside Fires (48.6%), and Structure Fires (38.8%).