Hudson: Fire Incidents, Colorado (CO)
Where are fire incidents reported in Hudson, CO
Something went wrong! Please refresh the page.
|
| |||||||||||||||||||||||||||||||||||||||||||||||||||||||||||||||||||||||||||||||||||||||||||||||||||||||||||||
2008 - 2018 National Fire Incident Reporting System (NFIRS) incidents
- Incident types reported to NFIRS in Hudson, CO
- 1,96459.5%Rescue & EMS
- 52615.9%Good Intent Call
- 44413.5%Fire
- 1303.9%Hazardous Condition
- 1163.5%False Alarm
- 962.9%Service Call
- 150.5%Special Incident
- 70.2%Overpressure Rupture
- Fire incident types reported to NFIRS in Hudson, CO
- 30668.9%Outside Fires
- 7416.7%Structure Fires
- 439.7%Mobile Property/Vehicle Fires
- 214.7%Other
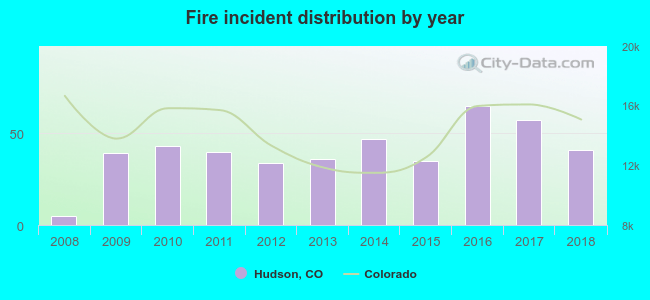 According to the data from the years 2008 - 2018 the average number of fires per year is 40. The highest number of fires - 65 took place in 2016, and the least - 5 in 2008. The data has an increasing trend.
 27.0% incidents where reported in the morning and 73.0% in the evening. The most fires (16.4%) took place on Monday, and the least (11.9%) on Friday.
 According to the 444 incident reports from years 2008 - 2018 most fires (17.8%) took place during July, and the least (4.1%) in February.
 Out of all 3,299 cases reported during the years 2008 - 2018, the most belonged to the categories: Rescue & EMS (59.5%), Good Intent Call (15.9%), and Fire (13.5%).
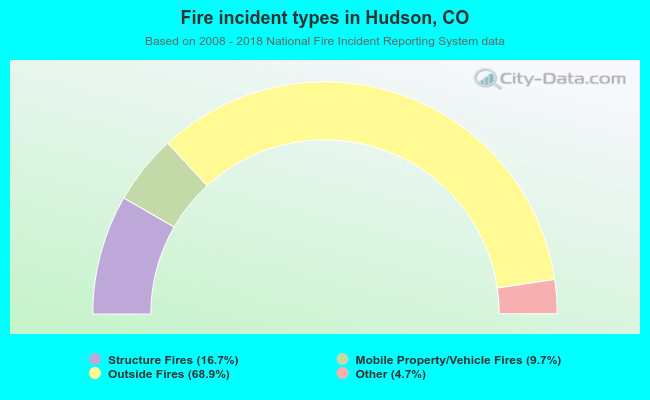 When looking into fire subcategories, the most incidents belonged to: Outside Fires (68.9%), and Structure Fires (16.7%).