Hueytown: Fire Incidents, Alabama (AL)
Where are fire incidents reported in Hueytown, AL
Something went wrong! Please refresh the page.
|
| |||||||||||||||||||||||||||||||||||||||||||||||||||||||||||||||||||||||||||||||||||||||||||||||||||||||||||||
2005 - 2018 National Fire Incident Reporting System (NFIRS) incidents
- Incident types reported to NFIRS in Hueytown, AL
- 94042.7%Rescue & EMS
- 46121.0%Fire
- 34115.5%Service Call
- 1958.9%Hazardous Condition
- 1466.6%Good Intent Call
- 1064.8%False Alarm
- 50.2%Special Incident
- 30.1%Overpressure Rupture
- 30.1%Severe Weather
- Fire incident types reported to NFIRS in Hueytown, AL
- 19843.0%Outside Fires
- 14832.1%Structure Fires
- 6213.4%Mobile Property/Vehicle Fires
- 5311.5%Other
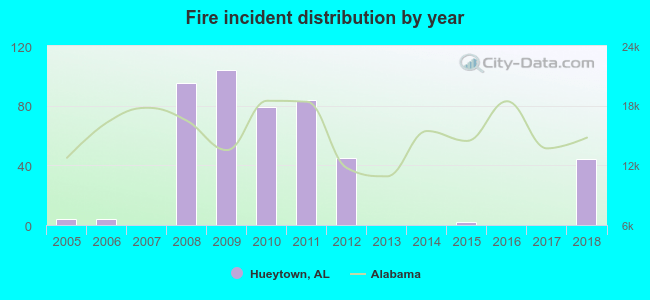 According to the data from the years 2005 - 2018 the average number of fires per year is 33. The highest number of reported fire incidents - 104 took place in 2009, and the least - 0 in 2007. The data has a growing trend.
The average number of yearly fire incidents per 10k residents in Hueytown, AL compared to nearest cities:
(Note: Based on data for the last 3 years, including only cities with population 5,000 and above)
| Hueytown: | 27.8 |
| Bessemer: | 92.8 |
| Pleasant Grove: | 30.3 |
| Midfield: | 63.3 |
| Fairfield: | 8.2 |
| Homewood: | 35.3 |
| Hoover: | 8.0 |
| Birmingham: | 87.0 |
| Vestavia Hills: | 20.2 |
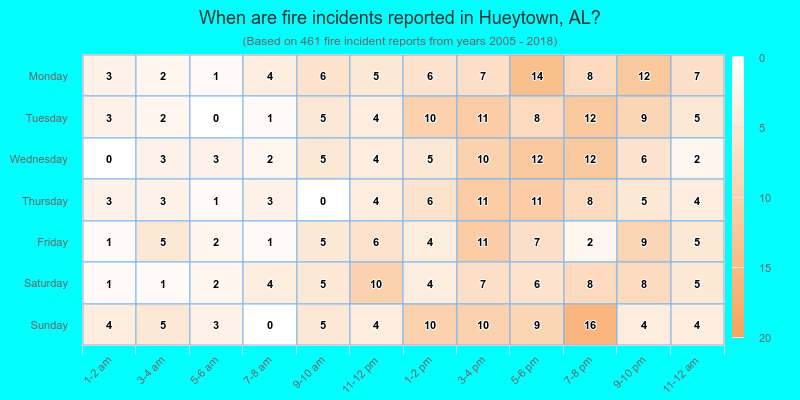
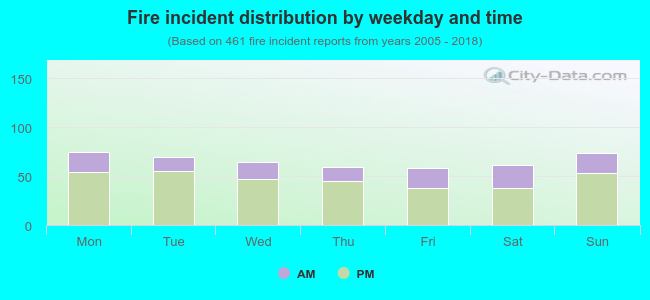 28.4% incidents where reported in the morning and 71.6% in the evening. The most fires (16.3%) took place on Monday, and the least (12.6%) on Friday.
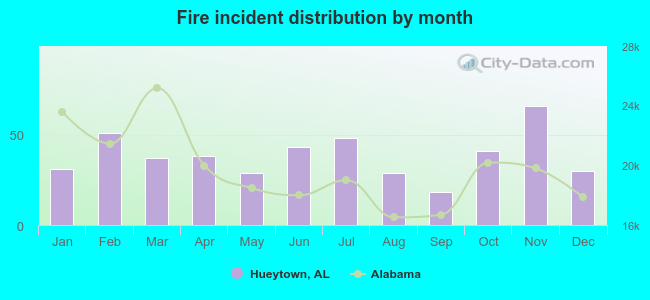 According to the 461 incident reports from years 2005 - 2018 most fires (14.3%) took place during November, and the least (3.9%) in September.
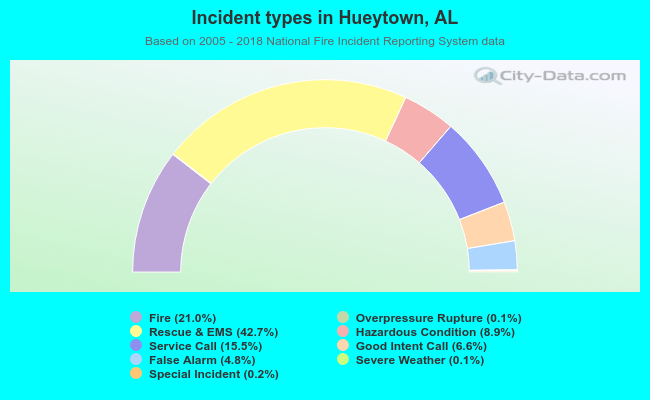 Out of all 2,200 cases reported during the years 2005 - 2018, the most belonged to the categories: Rescue & EMS (42.7%), Fire (21.0%), and Service Call (15.5%).
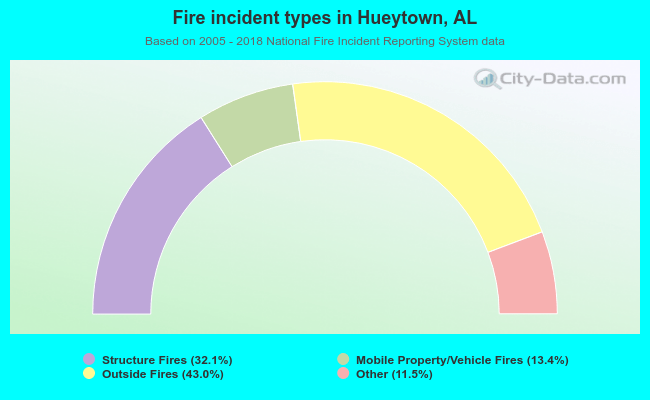 When looking into fire subcategories, the most reports belonged to: Outside Fires (43.0%), and Structure Fires (32.1%).