| Fire incidents reported |
|---|
| Sreet name | Count |
|---|
| 225 W. NORTH LOOP ROAD | 10 | | HWY 31 | 8 | | 200 NORTH | 6 | | 810 MCFADDEN RD | 6 | | 100 S. OTTESON LANE | 4 | | 100 SOUTH | 4 | | 107 EAST 400 NORTH | 4 | | 1175 NORTH OTTESON LANE | 4 | | 252 WEST 300 SOUTH | 4 | | 300 E | 4 | | 402 NORTH 300 EAST | 4 | | 455N 200W | 4 | | 500 EAST 500 SOUTH | 4 | | 506 NORTH MAIN | 4 | | 63 EAST 100 SOUTH | 4 | | 75 WEST 400 NORTH | 4 | | NORTH LOOP ROAD | 4 | | SOUTH FIELDS | 4 | | SR 31 | 4 | | 1 MILE S HUNTINGTON SR10 | 2 | | 1 MILE S ON SOUTH FIELDS | 2 | | 1 MILE SOUTH OF HUNTINGTON | 2 | | 100 EAST | 2 | | 100 EAST 250 SOUTH | 2 | | 100 N | 2 |
| | | Fire incidents reported |
|---|
| Sreet name | Count |
|---|
| 100 N 159 W | 2 | | 100 N. 200 W. #2 | 2 | | 100 NORTH 300 EAST | 2 | | 100 S 100 E | 2 | | 100 S OTTERSON LANE | 2 | | 100 WEST 100 SOUTH | 2 | | 102 SOUTH 400 WEST | 2 | | 110 W 100 N | 2 | | 1135 NORTH MOHRLAND RD HWY | 2 | | 124 SOUTH 400 WEST | 2 | | 125 EAST 300 SOUTH | 2 | | 133 NORTH MAIN | 2 | | 135 N 300 E TRAILER5 | 2 | | 1400 CENTER | 2 | | 1440 NORTH 200 WEST | 2 | | 150 N. 300 E. | 2 | | 157WEST 100N | 2 | | 158 WEST 100 NORTH | 2 | | 167 SOUTH 200 EAST | 2 | | 193 WEST 200 SOUTH | 2 | | 1980 EAST HIWAY 155 | 2 | | 2 MILES EAST OF SR 10 | 2 | | 200 N. MAIN STREET LGTS | 2 | | 200 NORTH 245 EAST | 2 | | |
|
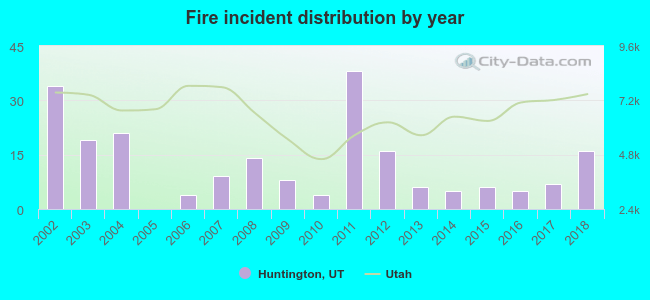 According to the data from the years 2002 - 2018 the average number of fires per year is 12. The highest number of reported fires - 38 took place in 2011, and the least - 0 in 2005. The data has a declining trend.
 17.9% incidents where reported in the morning and 82.1% in the evening. The most fires (18.9%) took place on Monday, and the least (9.4%) on Tuesday.
 Based on the 212 fire incident reports from years 2002 - 2018 most fires (16.5%) took place during March, and the least (2.4%) in December.
 Out of all 285 cases reported during the years 2002 - 2018, the most belonged to the categories: Fire (74.4%), Good Intent Call (9.8%), and Hazardous Condition (7.7%).
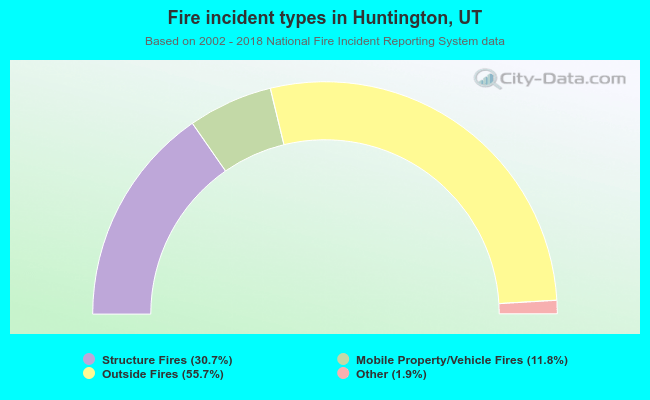 When looking into fire subcategories, the most reports belonged to: Outside Fires (55.7%), and Structure Fires (30.7%).