| Fire incidents reported |
|---|
| Sreet name | Count |
|---|
| COUNTY 37 RD | 28 | | US ROUTE 68 RT | 26 | | STATE ROUTE 366 | 22 | | STATE ROUTE 274 RT | 20 | | TWP RD 56 RD | 20 | | US ROUTE 33 RT | 20 | | WEST STATE ROUTE 274 RT | 16 | | ST RT 117 RD | 14 | | COUNTY 91 RD | 12 | | COUNTY ROAD 39 RD | 10 | | COUNTY ROAD 57 RD | 10 | | COUNTY 49 RD | 8 | | LIMA ST STS | 8 | | STATE ROUTE 274 | 8 | | TWP RD 221 RD | 8 | | COUNTY 57 RD | 6 | | COUNTY ROAD 101 RDS | 6 | | CR 130 | 6 | | CR 286 | 6 | | EAST STATE ROUTE 274 RD | 6 | | NAPOLEON ST | 6 | | RUDE ST | 6 | | SR 33 | 6 | | ST RT 368 RDS | 6 | | TWP 220 RD | 6 |
| | | Fire incidents reported |
|---|
| Sreet name | Count |
|---|
| TWP RD 100 RD | 6 | | VINE ST | 6 | | BUCKEYE DR | 4 | | COUNTY 101 RD | 4 | | COUNTY 130 RD | 4 | | COUNTY ROAD 97 RD | 4 | | CR 286 ST | 4 | | CR 39 | 4 | | CR 91 | 4 | | FINDLAY ST | 4 | | FRUIT STS | 4 | | SR 274 | 4 | | STATE ROUTE 117 RT | 4 | | STATE ROUTE 235 RT | 4 | | STRT638 HWY | 4 | | TOWNSHIP ROAD 108 | 4 | | TOWNSHIP ROAD 95 | 4 | | TR 56 | 4 | | TWP 56 RD | 4 | | TWP 95 RD | 4 | | TWP RD 108 RD | 4 | | TWP RD 220 | 4 | | TWP RD 99 RD | 4 | | WILLOBY ST | 4 | | |
|
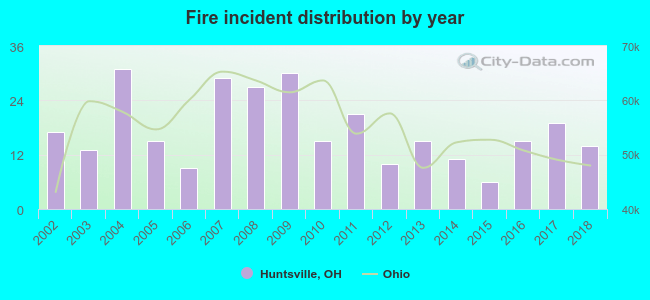 According to the data from the years 2002 - 2018 the average number of fire incidents per year is 17. The highest number of reported fires - 31 took place in 2004, and the least - 6 in 2015. The data has a dropping trend.
 27.3% incidents where reported in the morning and 72.7% in the evening. The most fires (21.2%) took place on Saturday, and the least (11.4%) on Friday.
 According to the 297 incident reports from years 2002 - 2018 most fires (17.5%) took place during April, and the least (4.4%) in June.
 Out of all 753 cases reported during the years 2002 - 2018, the most belonged to the categories: Fire (39.4%), Overpressure Rupture (27.2%), and Rescue & EMS (12.9%).
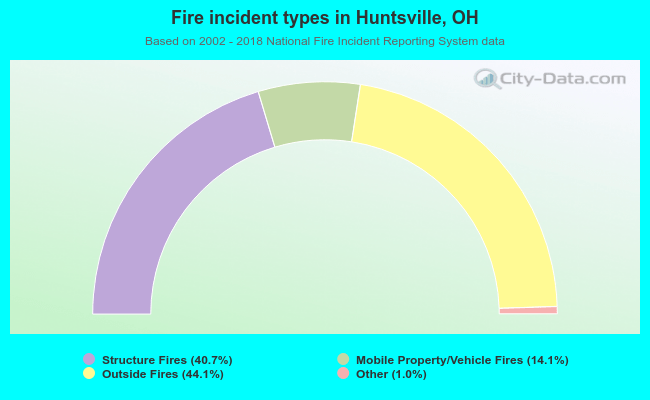 When looking into fire subcategories, the most incidents belonged to: Outside Fires (44.1%), and Structure Fires (40.7%).